2023 was a good year for the stock market.
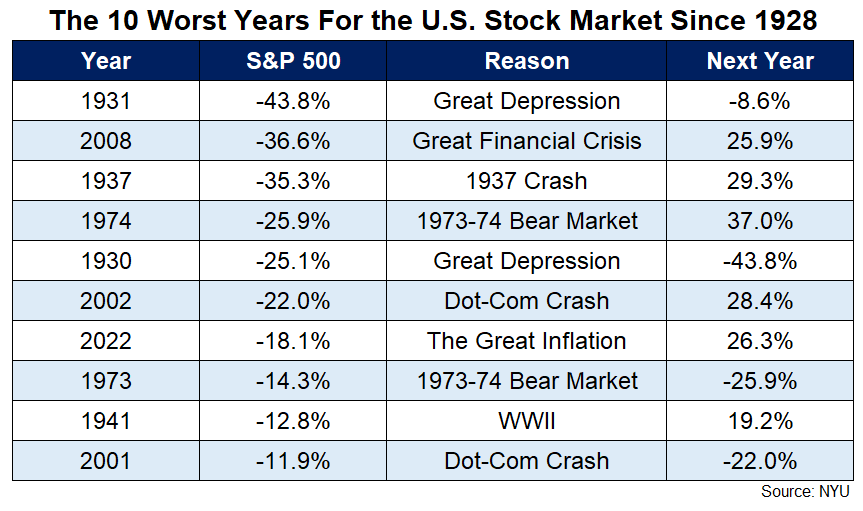
Bad years in the stock market are typically followed by good years (but not always):
The obvious follow-up here is: What happens after good years? Or how often do we see good years followed by good years?
There are, of course, bad years that follow good years, just like there are good years that follow bad years. Here are all of the down years following a double-digit up year since 1928 for the S&P 500:
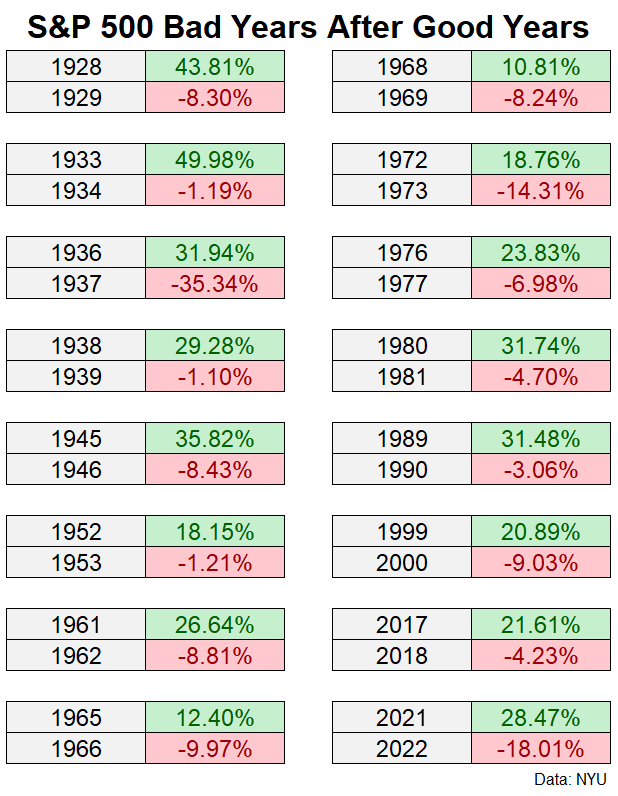
This happened as recently as 2022 following the blowout year in 2021.
Human psychology causes many of us to constantly worry something bad has to happen after something good happens.
The gains can’t last.
All of the good news is priced in.
The easy money has been made.
Stocks are priced for perfection, yada, yada, yada.
That could be the case this time around. Maybe the market has gotten ahead of itself. Maybe stocks have already priced in a soft landing and multiple Fed rate cuts in 2024.
The good times never last forever, so it’s reasonable for investors to consider downside risks after things go well.
It’s also important to remember the good times can last longer than you think.
It’s hard to imagine the stock market could follow-up 2023 with another big gain considering the S&P 500 gained more than 26% last year.
But good years tend to cluster in the stock market.
I looked back at the annual returns for the S&P 500 since 1928 to find times when big gains were followed by more big gains.
It happens more often than you think.
Here are the double-digit up years that were followed by double-digit up years:
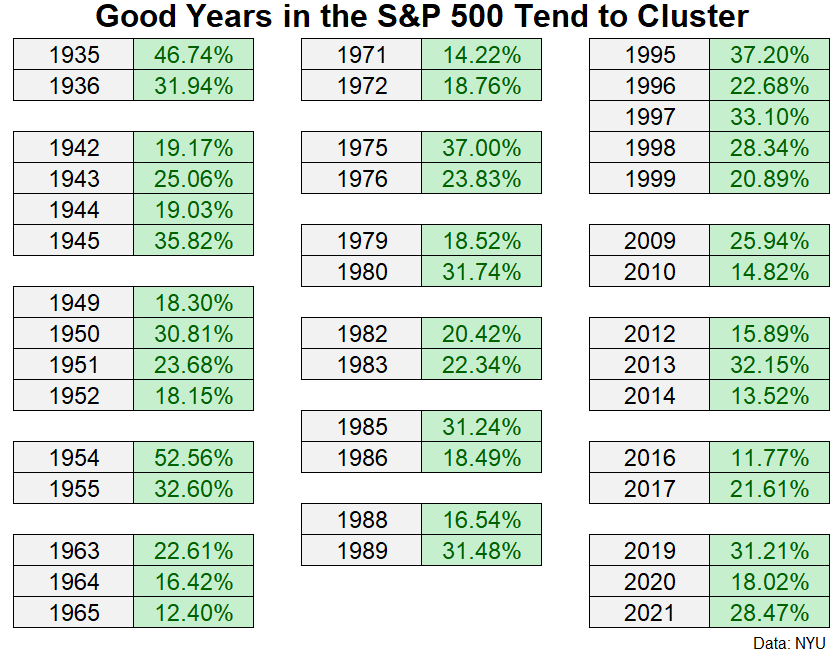
I found 16 separate clusters spanning 40 years in total. That’s more than 40% of the time.
You don’t have to go too far back in stock market history to find a time when we had a string of good years in a row. The 2019-2021 stretch was pretty darn good with +31%, +18% and +28% back-to-back-to-back.
Of course, that stretch was followed by the terrible 2022 performance.
The ramp-up to the dot-com bubble from 1995-1999 was an all-time run with five years in a row of 20%+ gains but there have been plenty of periods where good years bunch up.
There were four year runs of good results from 1942-1945 and 1949-1952. We had pretty good returns from 2012-2014 as well.
These are the median returns for the S&P 500 in the ensuing year following gains of 10% or more, 15% or more and 20% or more:
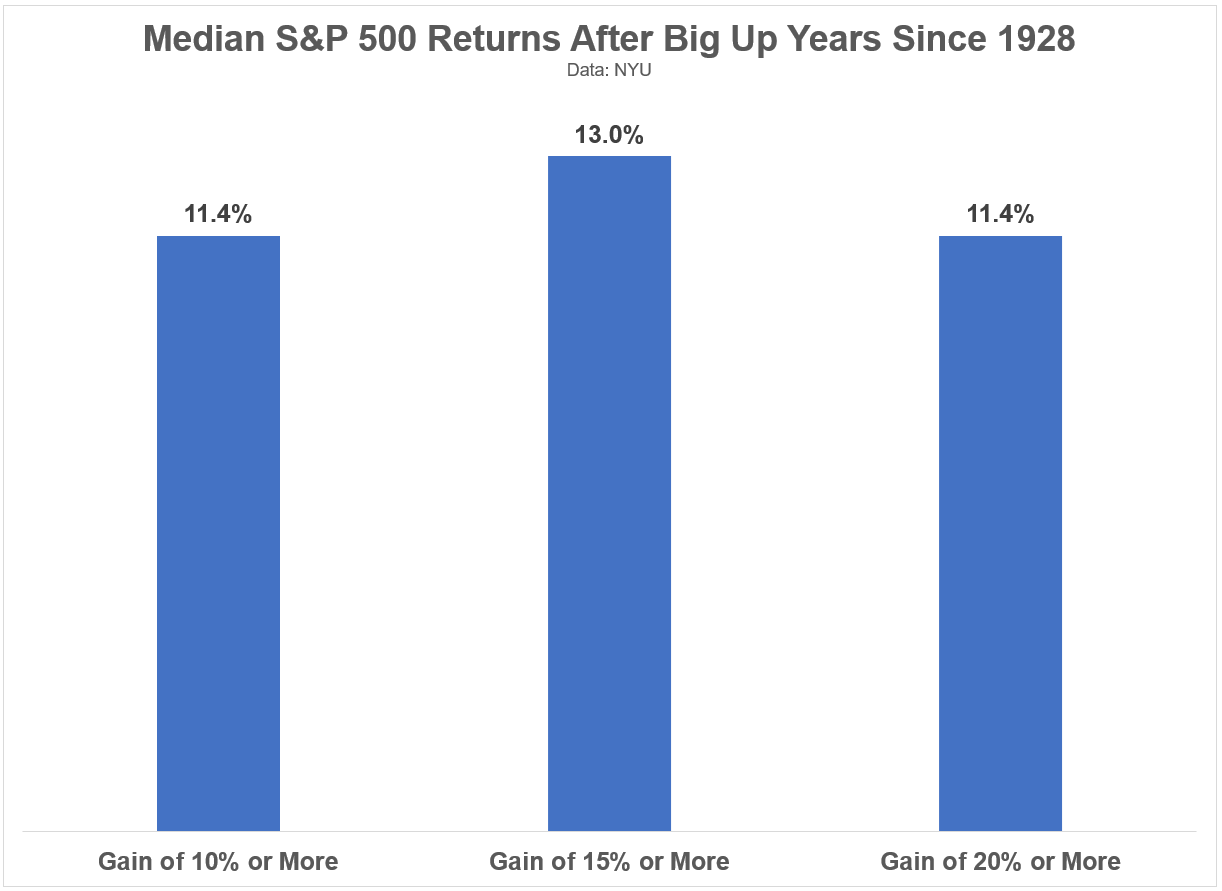
There were gains 70% of the time following 10%+ gains, 70% of the time following 15%+ gains and 65% of the time following 20%+ gains.
All of which is to say there’s not much you can glean from 2023 returns if you’re looking for some sort of pattern.
Many times good returns are followed by good returns but sometimes good returns are followed by losses.
This is what makes investing in the stock market equal parts exhilarating and infuriating, especially in the short run.
How about long run returns?
The median 10 year total returns following 10%+, 15%+ and 20%+ up years were +173%, +234% and +188%, respectively over the past 95 years.1
Long run returns are the only ones that matter but short run returns get all of the attention.
Wise investors focus on the long run and avoid allowing the short run to dictate investment decisions.
Further Reading:
2023: It Was a Good Year
1That was annual returns of 11%, 13% and 11%, respectively.
