It’s been a while but we’re back:
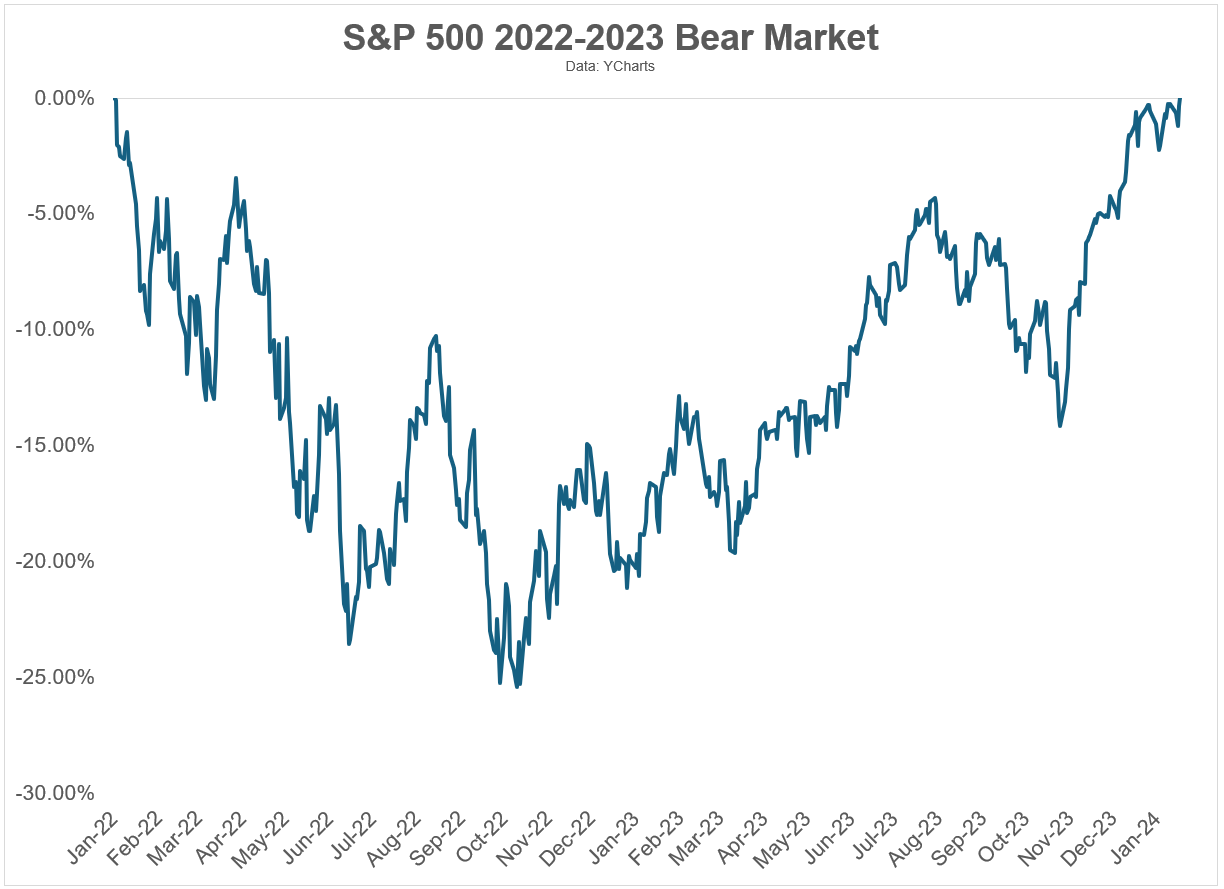
After a little more than two years, the S&P 500 finally took out the highs from January 2022 on Friday.
New all-time highs!
This bear market felt nasty in 2022 but it was fairly run-of-the-mill when compared with the biggest downturns over the past 70+ years.
Here’s an updated table of S&P 500 bear markets since 1950 along with the number of days it has taken to go peak-to-trough along with the prior peak-to-new highs:
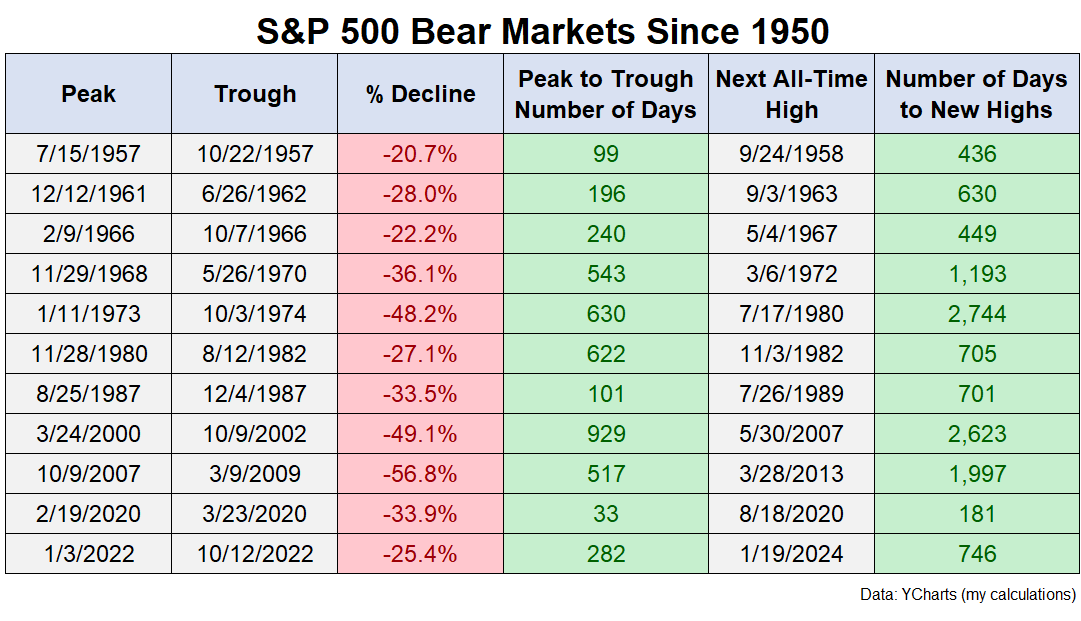
The average bear market since 1950 has seen a drawdown of 35%, taking 381 days to bottom out and more than 1,100 days to go from the prior peak to new all-time highs.1
This is the kind of thing you should expect to happen every five or six years.2
Of course, we’ve now experienced two bear markets in four years but that’s how market averages work. You can’t set your watch to these things.
So what happens next?
I don’t know, of course, but it is interesting to look at what’s happened after the stock market hit new highs following bear markets in the past.
Here’s a look at the one, three, five and ten year returns3 from new highs following a bear market:
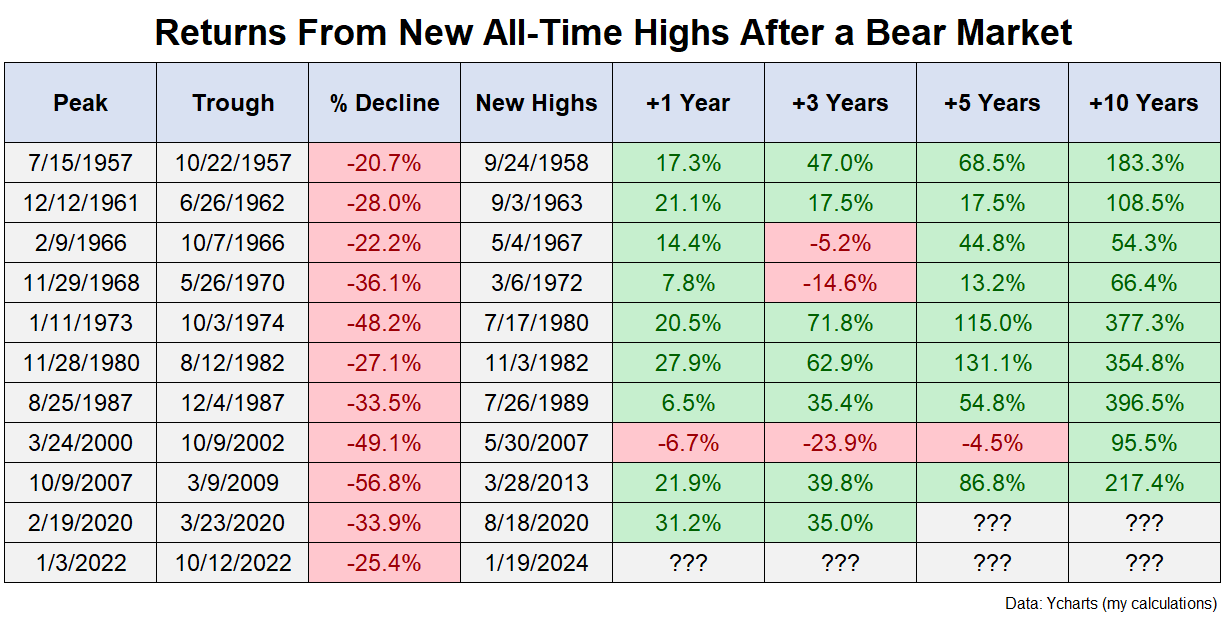
Most of the time new highs are followed by more new highs. The average one, three, five and ten year total returns following new highs were +16%, +27%, +59% and +206%, respectively.
That’s pretty good.
Really the only time new highs were hit and another bear market quickly followed was in 2007. New highs came in May 2007 while the peak for the Great Financial Crisis came in October of the same year.
The early 1970s experienced two dreadful bear markets in short order as well.
As always, there are exceptions to the rules when it comes to the markets.
I don’t know what happens from here. It’s anyone’s guess.
What I do know is that thinking and acting for the long term is typically rewarded when it comes to the stock market.
Staying the course still works.
Further Reading:
Staying the Course is Harder Than it Sounds
1If you were to take out the three biggest crashes (1973.1974, 2000-2002, and 2007-2009), the average old peak to new peak was an average of 614 days.
2Including the most recent one, there have been 11 bear markets since 1950 or one every six-and-a-half years.
3I wanted total returns here since they’re longer-term, but I didn’t feel like calculating the price returns to the exact day (it takes a lot of time). So these are total returns from the first full month after new highs (meaning the returns are probably even a tad understated). Close enough.
