A reader asks:
What would be the pros and cons of purchasing weighted amounts of the 11 stock market sectors and rebalancing your portfolio each year rather than just indexing the total market or the S&P 500? One is obviously much more time-consuming, but could the juice be worth the squeeze?
I’ve actually been asked this question before over the years.
The premise makes sense from the perspective of rebalancing and the fact that the winning and losing sectors change from year-to-year. The hope would be that you’re trimming your winners to buy your losers and those losers eventually turn into winners.
Before sharing some thoughts on this strategy, let’s dig into some numbers.
Here are the current sector weights from State Street as of January 9, 2024:
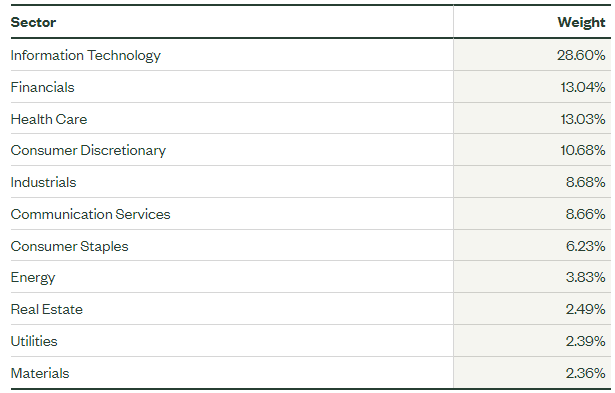
An equal-weighted strategy would mean you’re underweighting technology, financials, and health care while overweighting materials, utilities, real estate, energy and consumer staples. Communications, industrials and consumer discretionary are all basically a push.
Sector weightings do change over time but you would be adding some real tracking error to the S&P 500 by taking on a strategy like this.
Since the asset allocation quilt is so fresh in my mind, let’s look at the performance numbers of the various sectors going all the way back to 2008 to see how this would look in a backtest:
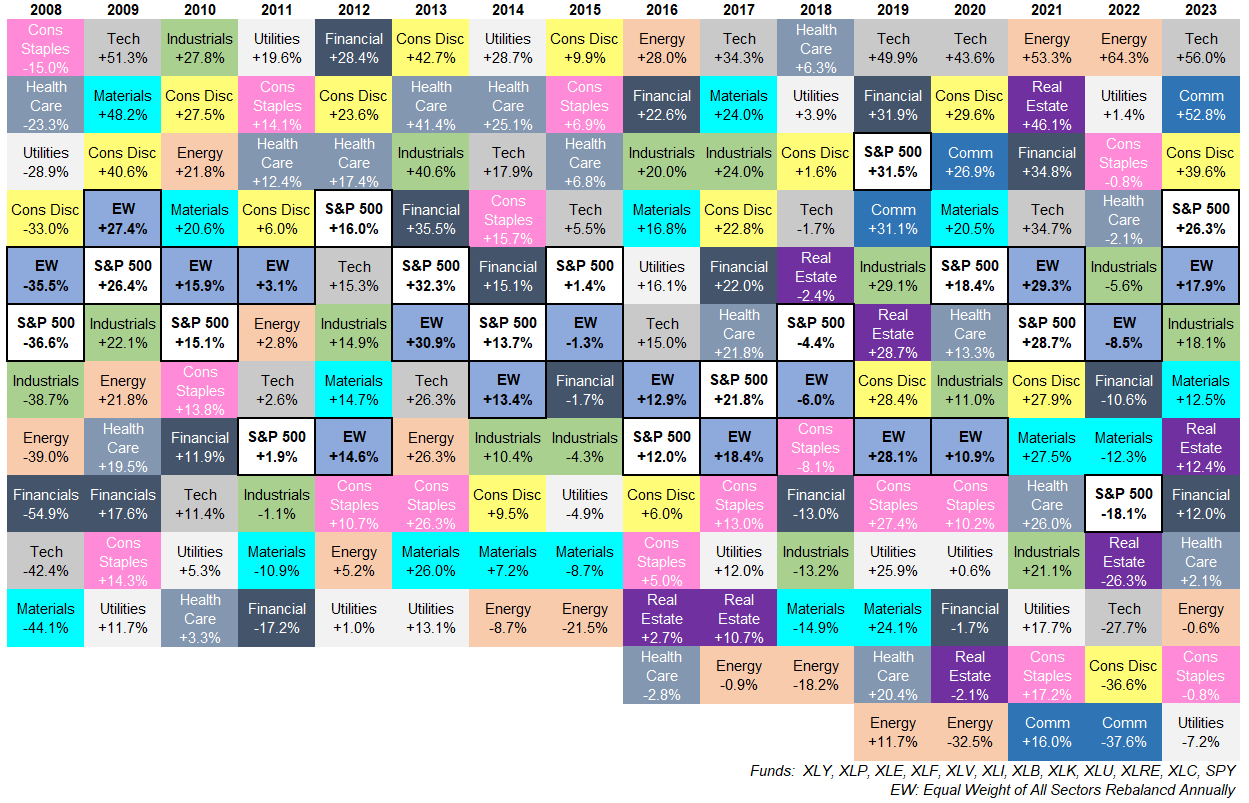
(Right-click and hit ‘open image in new tab’ if you would like to see this as a larger image on desktop.)
Unfortunately, the sector quilt doesn’t look nearly as pretty as the asset allocation quilt since Standard & Poors has added two new sectors over the years — real estate and communications.1
I’ve highlighted both the S&P 500 and equal weight sector (EW) returns on this graphic. You can see it’s pretty close just from eye-balling the numbers. The S&P 500 has outperformed in 9 out of the past 16 years meaning the equal weight sector strategy would have outperformed 7 of the past 16 years.
The S&P 500 outperformed the equal weight strategy overall as well but it was fairly close: +9.8% per year to +9.2% per year.
Health care, technology and consumer discretionary were the only sectors to outperform the S&P 500 from 2008-2023. They were up 10.7%, 14.7%, and 12.7% per year, respectively, versus an annual gain of 9.8% for the S&P 500. The worst-performing sector was energy, which was up just 3.5% per year in this time frame.
The technology underweight is the obvious source of the underperformance here.
The equal weight did lower volatility by nearly 10% so that’s a win. You can see it outperformed by a wide margin in 2022 (thank you energy stocks) only to underperform by a similar margin in 2023.
My biggest problem with this strategy is that it’s needlessly complex. I prefer simplicity when it comes to investing.
Owning an S&P 500 index fund is simple. They do the rebalancing for you when companies enter or exit the index. It doesn’t require you to hold 10 separate ETFs and rebalance them periodically back to equal weights. It also doesn’t require you to add more funds to your line-up when new sectors are created.
Even if the equal weight strategy outperformed in a backtest, I’m not sure it would be worth the hassle.
And if you want to break free from the market cap-weighted index methodology of the S&P 500, there are easier ways to do it.
You can simply buy an equal-weighted S&P 500 index. There’s an ETF for that (ticker RSP).
I calculated the returns for our equal-weight sector strategy to the S&P 500 and the equal-weight S&P 500 to see how they performed over various time frames and environments in the recent past:
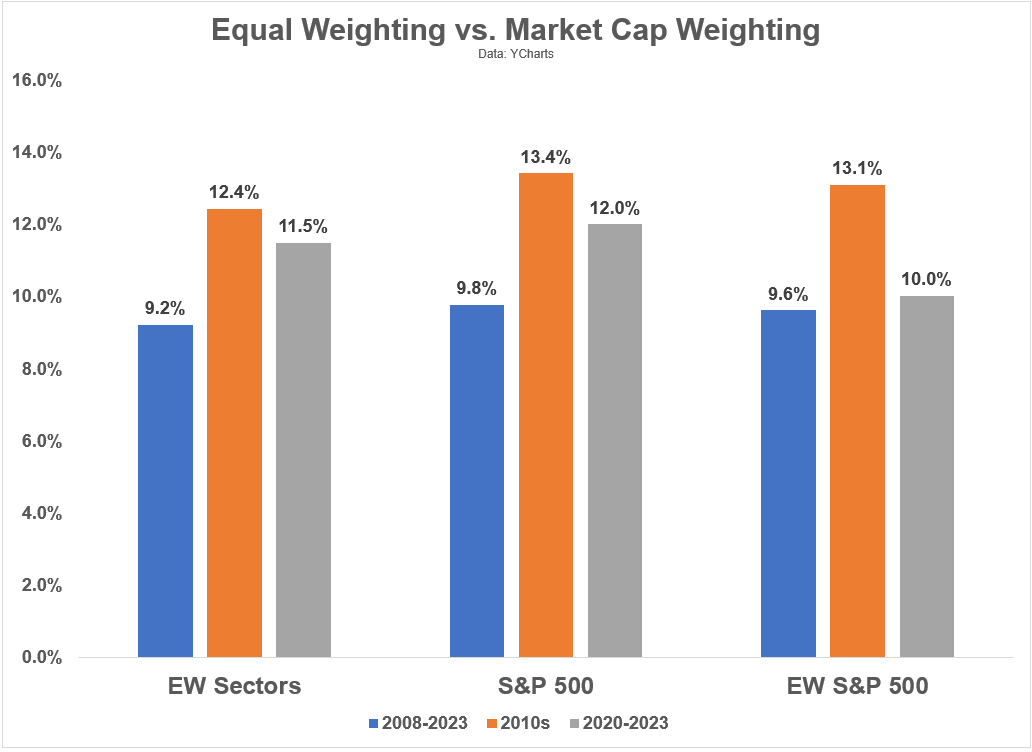
The reason I wanted to look at these various time frames is to include a crash (2008), a bull market (the 2010s) and a more volatile period (the 2020s).
The S&P 500 outperformed in every one of them. The equal-weight sector strategy looks better than the equal-weight S&P 500 during the 2020s but not the 2010s.
Equal weighting will likely outperform the cap-weighted S&P 500 at some point. It did so in the pre-GFC mini-bull market:
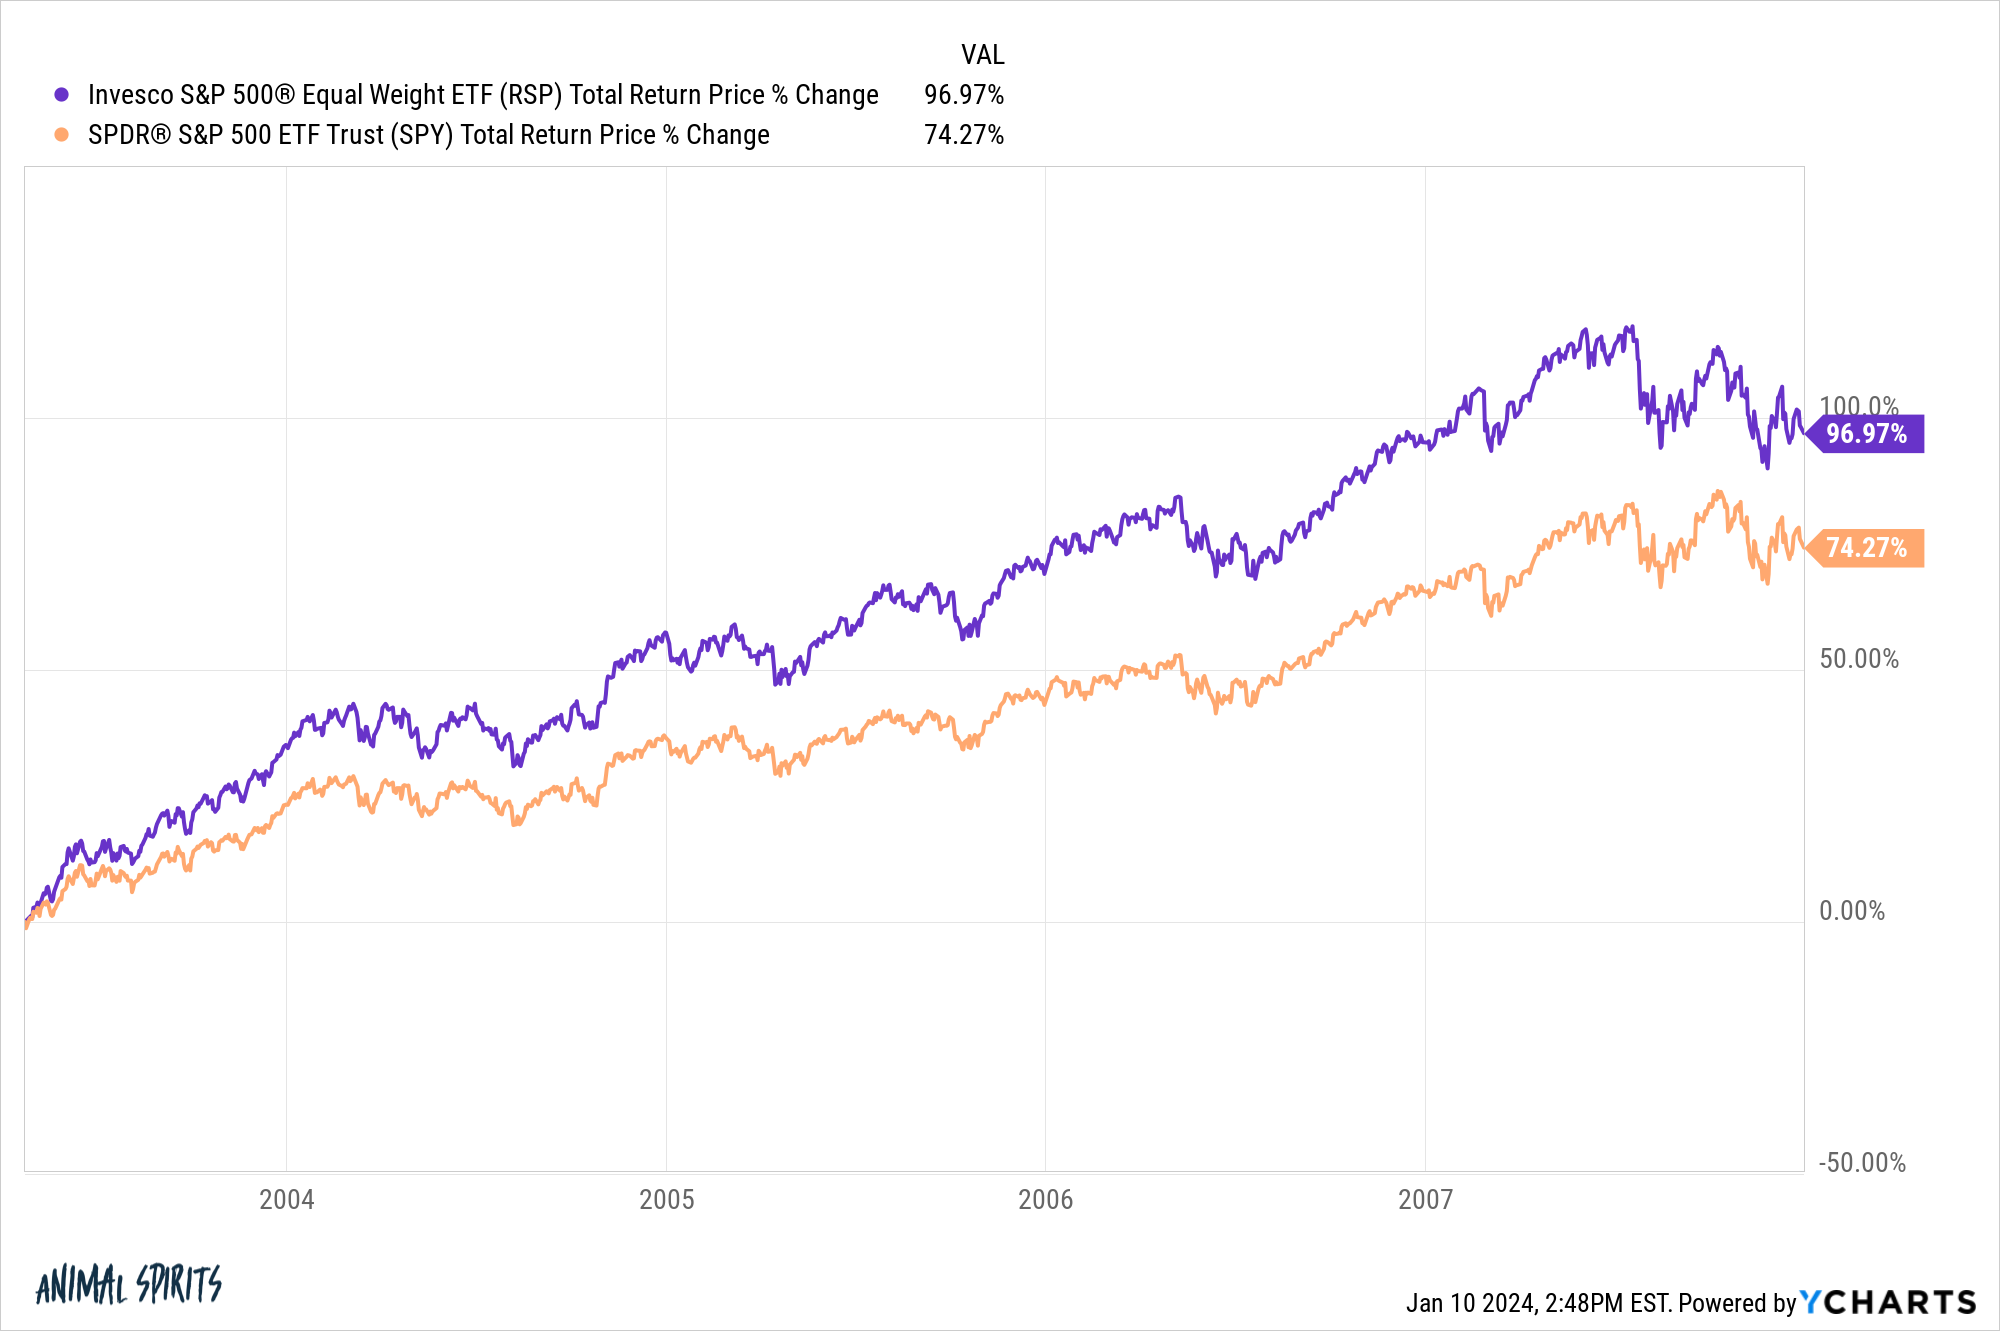
Some other factor outside of mega-tech stocks will outperform at some point. Equal weight will look better than market weight when that happens.
There are plenty of ways to diversify your exposure outside of the S&P 500 if you’re nervous about the large cap index underperforming at some point. Small caps, mid caps, international stocks, value stocks, low-vol stocks, quality stocks, dividend stocks, etc., all fit the bill here.
The proliferation of ETFs makes it easier than ever to gain exposure to different types of stocks, factors and investment strategies in a tax-efficient manner with low fees.
I wouldn’t try to get too cute with your portfolio strategies.
The S&P 500 is hard enough to beat in the simplest form.
The markets themselves are extraordinarily complex.
Don’t try to make investing more complicated than it needs to be
We tackled this question on the latest edition of Ask the Compound:
Tax expert Bill Sweet joined me yet again this week to discuss questions about investing in Bitcoin, having your taxes and portfolio managed by the same firm, the tax consideration of paying off your mortgage early, and how to manage your money for early retirement.
Further Reading:
Updating My Favorite Performance Chart For 2023
1I really don’t understand the reasoning for adding them either. The real estate sector is tiny and the communications sector is almost 50% Google and Facebook.

