I love studying financial market history.
You can’t predict the future by learning about the past but it can help you better understand the relationship between risk, reward and human nature.
If you look back at enough charts and read enough books about market history, you’re invariably drawn to the booms and busts.
And looking into the booms and busts makes you look at certain dates and outlier events.
The top in September 1929. The Dow going nowhere from 1966-1982. The start of the stock and bond bull market in the early-1980s. The Black Monday crash in October 1987. The top in March 2000. The bottom in March 2009.
The problem with looking at the markets from the vantage point of static start and end points is that it’s simply not realistic for the vast majority of investors.
How many investors put their money in at one point in time and just leave it be? And how many investors do so at the precise top or bottom in the market?
No one actually invests that way (except Bob).
You make periodic contributions from your paychecks over time. Or if you’re done saving, you’re taking withdrawals. Or reinvesting income and dividends. Rebalancing your portfolio. Changing your asset allocation.
Investing looks static through the lens of charts and historical returns. In the real world, investor portfolios are constantly in a state of flux and not controlled by a single purchase or sale that could occur at an opportune or inopportune time.
When you think about the markets from the perspective of the lived experience for most investors, it can change how you should feel about bull and bear markets depending on where you are in your investing lifecycle.
For instance, last year was the 7th worst calendar year return for the S&P 500 since 1928. It’s difficult for investors to consider one of the worst years in history as a positive.
But last year’s awful performance was a great thing for anyone who was putting money into the market on a periodic basis. Bear markets are great for dollar cost averaging.
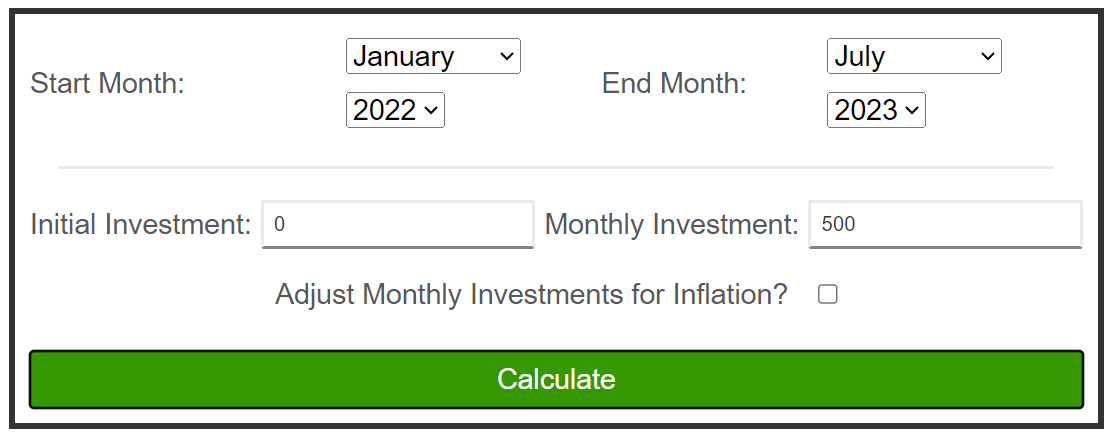
My colleague Nick Maggiulli created a lovely DCA calculator at Of Dollars and Data that allows you to look at the outcomes from monthly investments using 150 years or so of historical data from Robert Shiller.
The stock market peaked on January 3rd of 2022 so I used Nick’s tool to see what the results looked like for someone investing $500/month starting in January 2022 through July of this year:
These are the results:
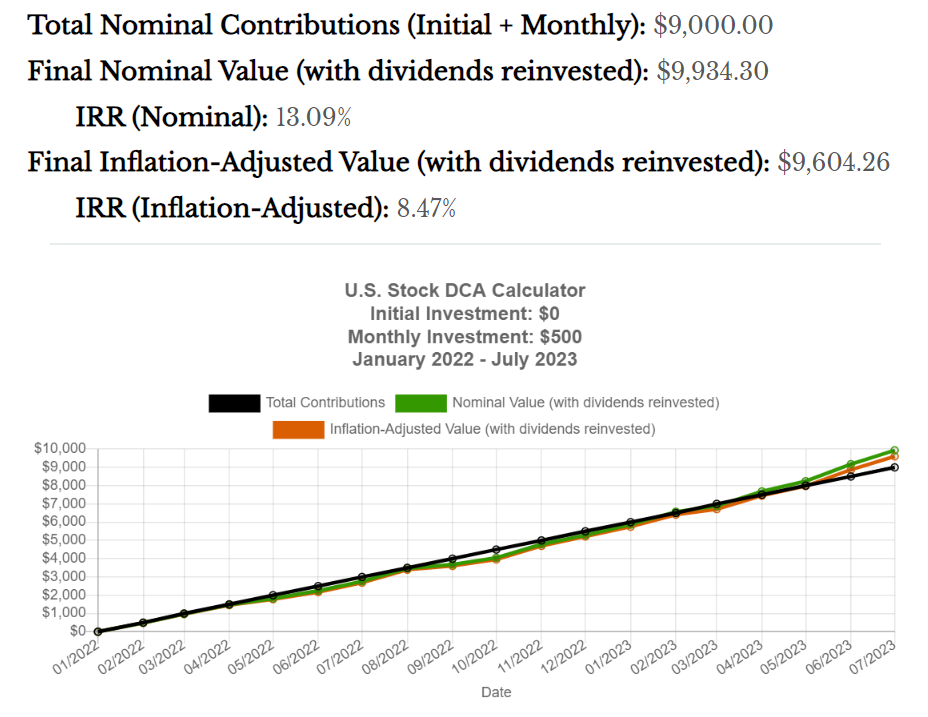
From the start of 2022 through July 2023, the S&P 500 was down 1.2% in total.
But dollar cost averaging each month over that same time frame would have given you an internal rate of return of more than 13%. Even after accounting for elevated inflation, your IRR was nearly 9%.
Regularly investing your money during a down market does wonders for your future returns.
Obviously, it’s easy to look back at these things after the market has come roaring back.
But down markets are a wonderful time to get long-term bullish.
And the best part about investing on a set interval — quarterly, monthly, weekly, etc. — is that you diversify your entry points.
You don’t have to worry as much about tops and bottoms. Some purchase points will be better than others but so it goes.
Dollar cost averaging is far from the perfect investment strategy. The good news is you don’t need to be perfect to find investment success.1
You just have to be consistent.
That consistency matters most during down markets.
Further Reading:
Bear Markets Are Transitory
1It’s also true that the perfect investment strategy is only ever known with the benefit of hindsight.

