The rise in interest rates has led to a slaughter in long-term U.S. Treasuries.
Even when we include the income earned on the bonds (which hasn’t been much in recent years), TLT is in the midst of a 40%+ drawdown:
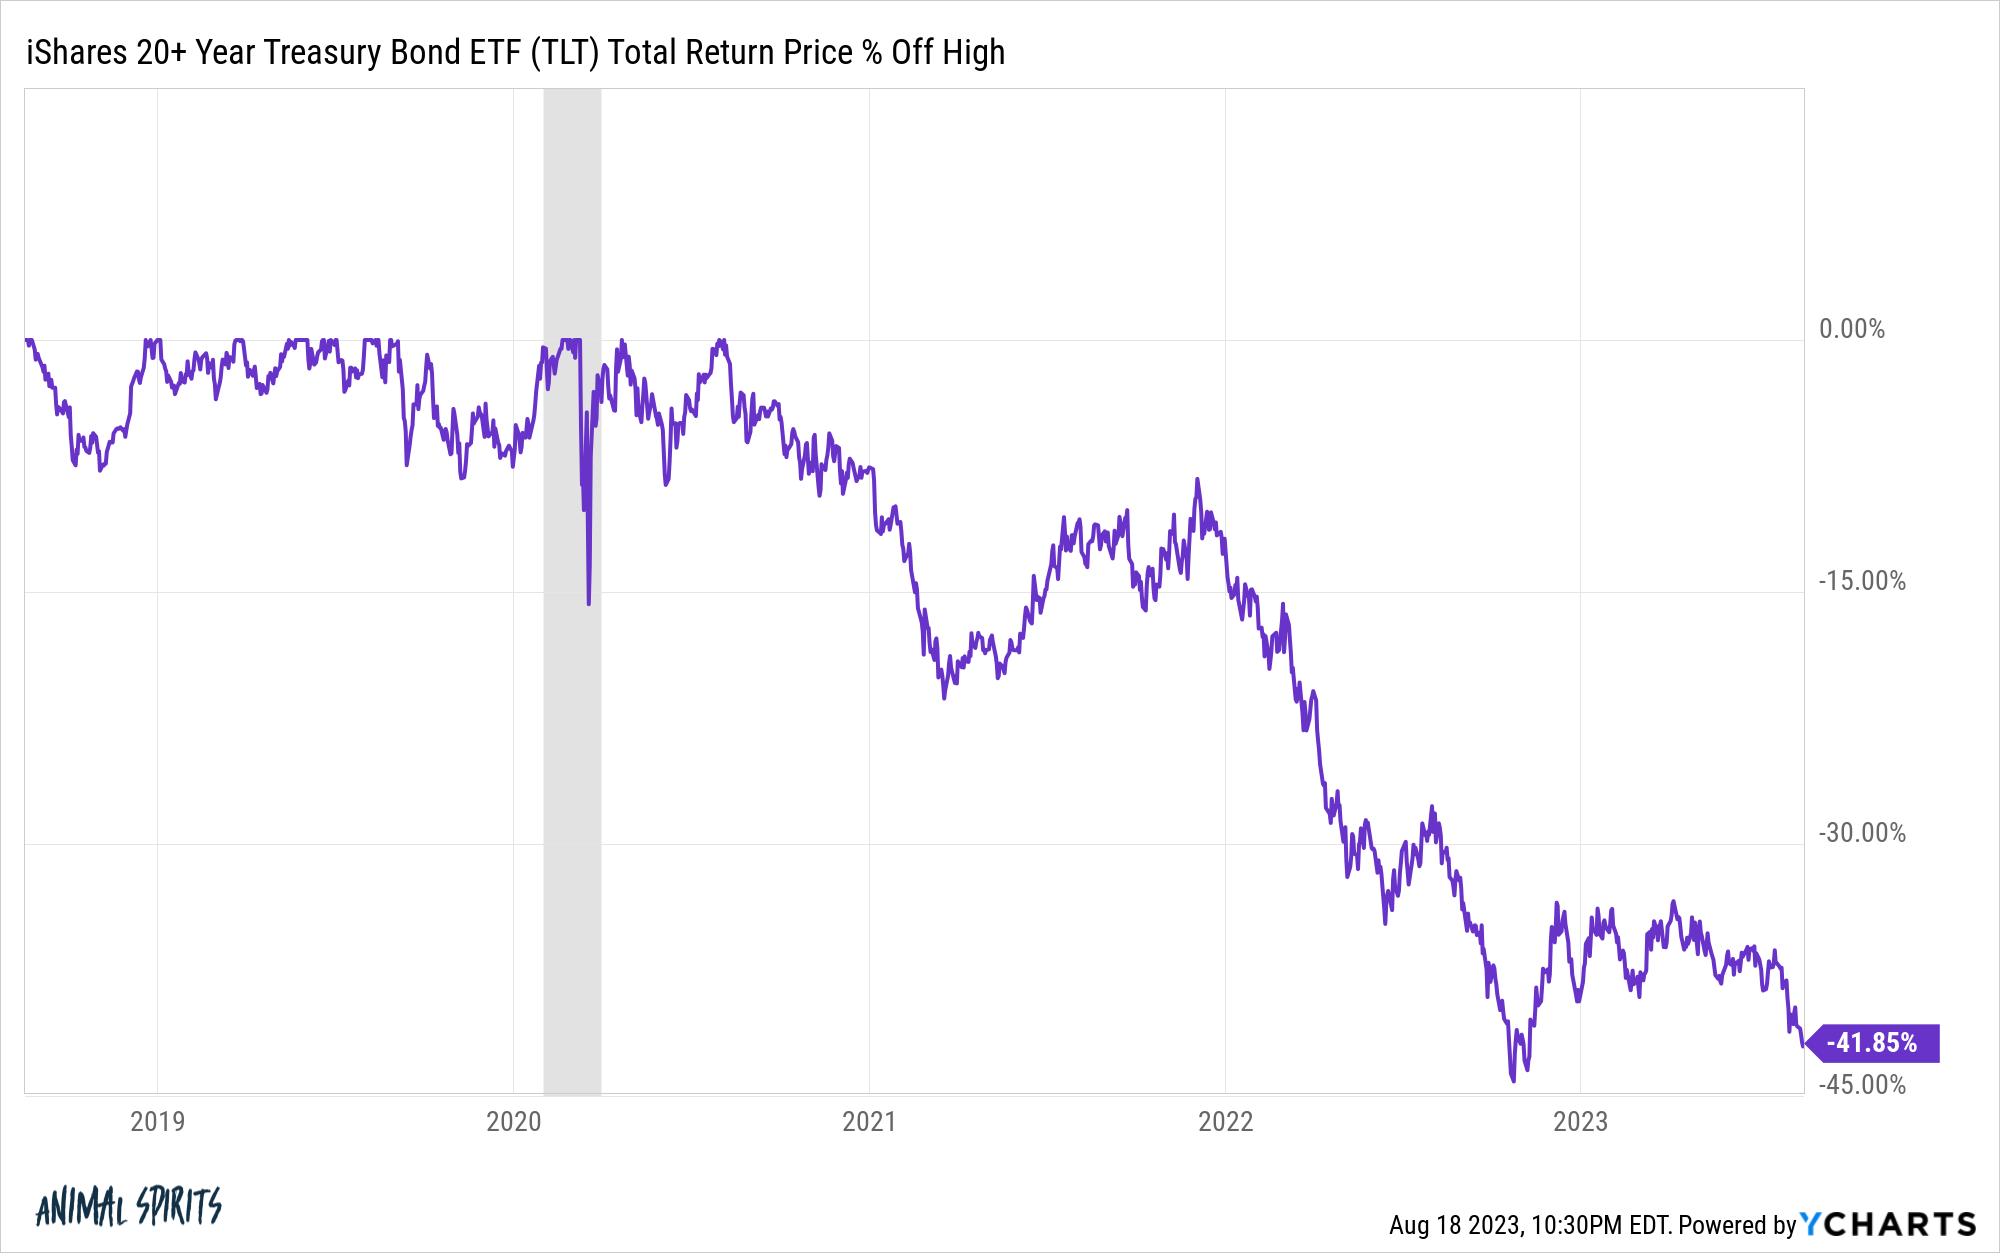
Losses of this magnitude can erase years and years of gains.
We’re now closing in on a lost decade for long-term bonds. These are the total returns over the past 9 years:
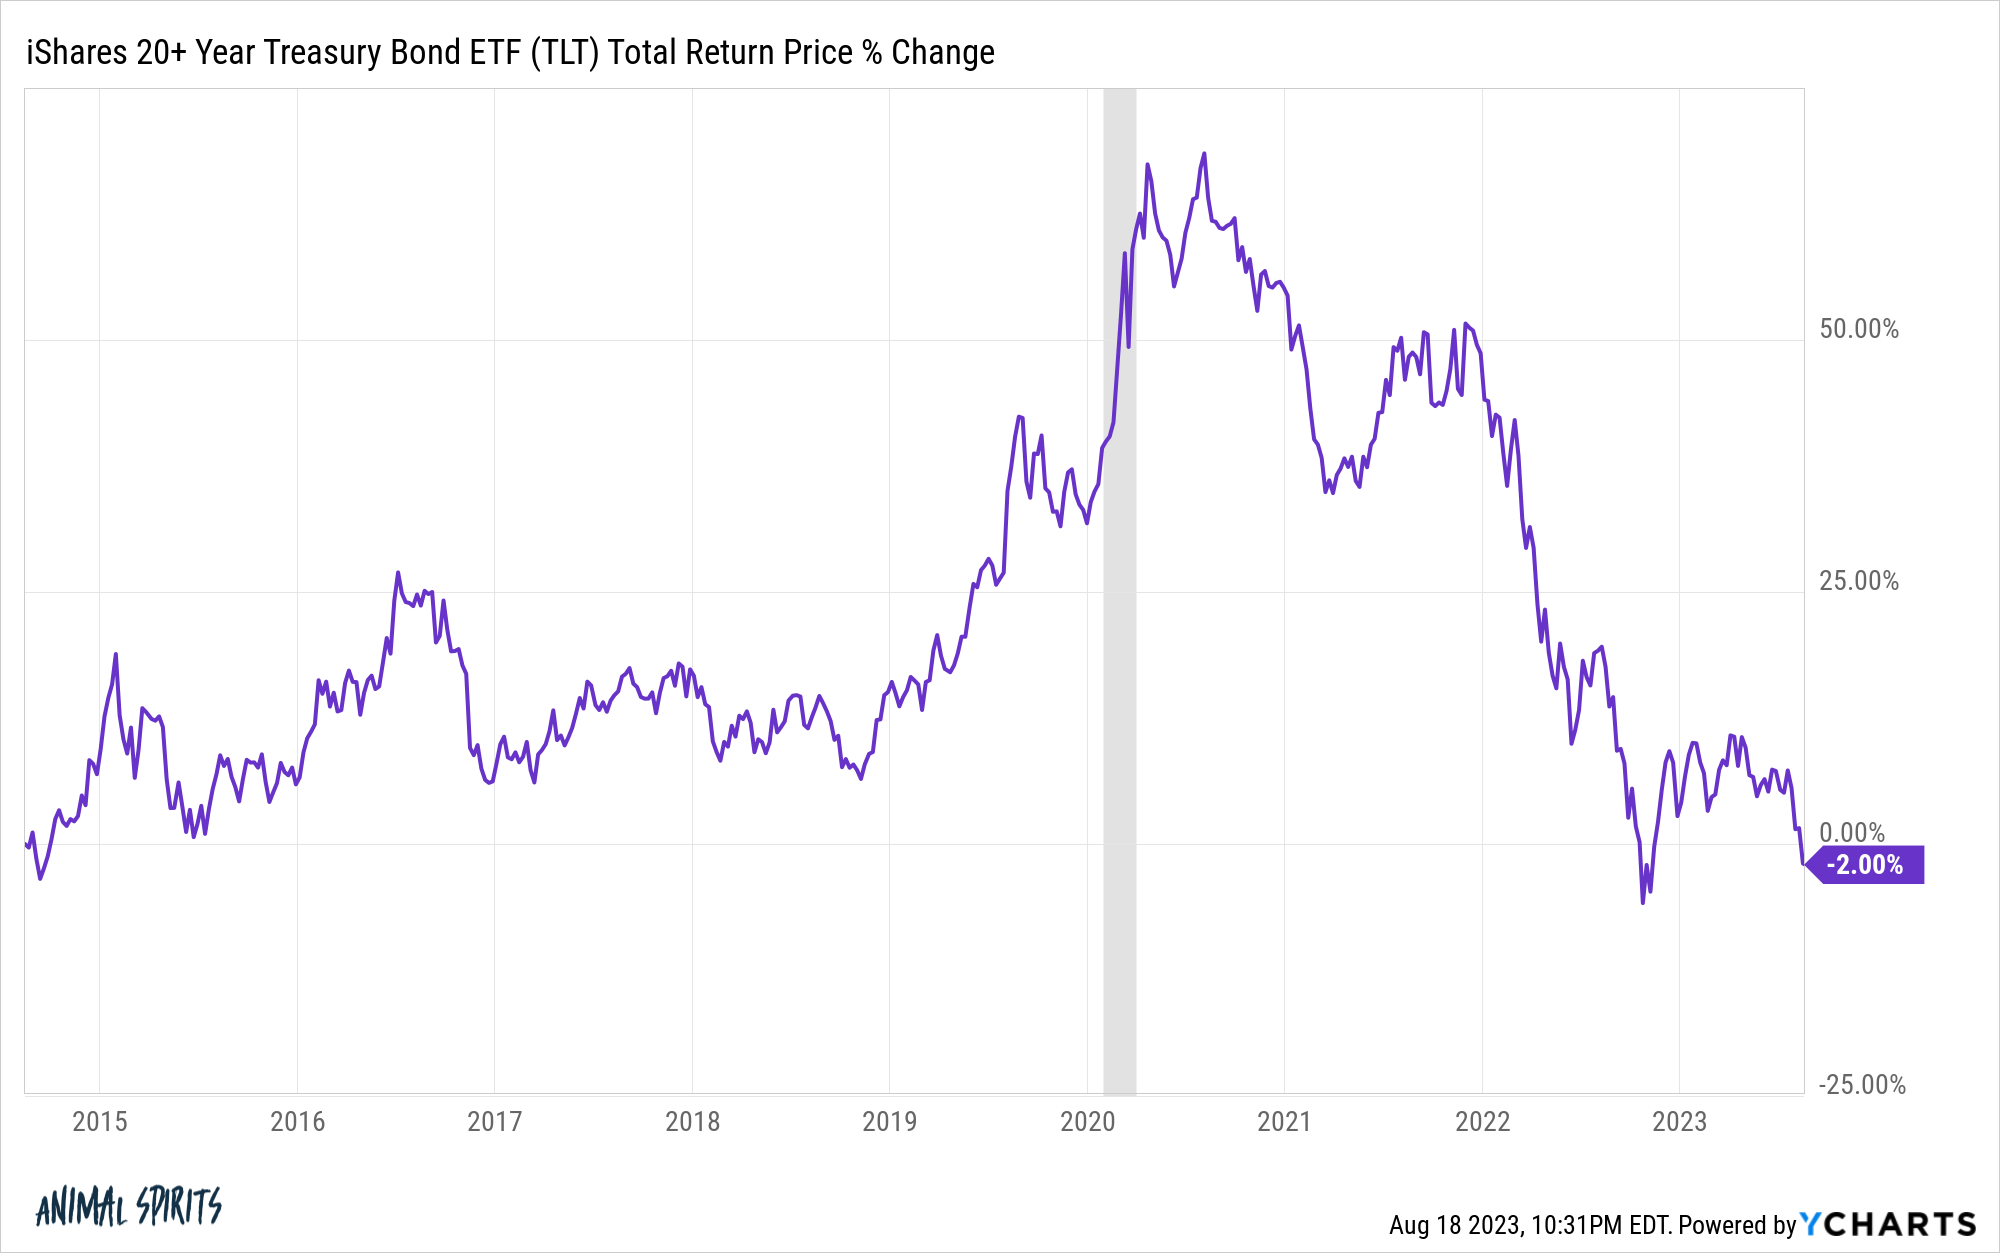
This is a new phenomenon in recent decades for long duration bonds.
Before interest rates finally started to rise of late, long-term bonds were in the midst of one of the greatest bull markets of all-time.
Long bonds have gotten crushed in recent years but they were on a ridiculous run prior to the current cycle of high inflation and rising rates.
In the 25 years ending in March of 2020, long-term bonds had better annual returns than the S&P 500 — 8.2% to 8.0% — and they did so with one-third less volatility.
Long bonds also outperformed U.S. stocks in the nearly 30 year period starting in 1981 and ending in February of 2009 — 10.6% to 9.2%.
Most of the time stocks beat bonds over the long run but not always.
It’s probably also worth noting long-term bonds lost more than 50% of their value after accounting for inflation from 1950 through 1981.
Inflation and rising rates were a killer.
All of these start and end dates were cherry-picked, of course, but I did so for good reason.
Everything underperforms at some point.
You just don’t know when or for how long plus your start and end dates have a lot of say in the matter.
A lost decade for bonds is a relatively new experience but plenty of other asset classes have seen that in the recent past.
The S&P 500 went through a lost decade from 2000-2009, with a total return of -9% for those 10 years.
In that same period emerging market stocks were up more than 160%. Gold was up nearly 275% to kick off the first decade of the 21st century.
However, emerging markets went nowhere from 2008-2016, with a total return of -11%.
Gold peaked in the summer of 2011 at roughly $1,900 an ounce. It wouldn’t reach that level again until the summer of 2020. Pretty close to a lost decade there too.
Warren Buffett compounded Berkshire Hathaway shares at an annual run rate of 19.8% per year from 1965-2022, doubling up the return on the S&P 500 of 9.9% in that time.1
However, more than 30% of that time the S&P 500 outperformed Berkshire Hathaway over rolling 3 year times frames.
From 1995-1999 Berskshie Hathaway was up an impressive 175% in total. However, the Nasdaq composite was up 450% in that time.
After the Nasdaq was up 41% per year from 1995-1999 the cumulative return from 2000-2012 was -19.1%. That was nearly a decade-and-a-half with no progress.
Over the past 95 years, cash has outperformed stocks 31 times. Bonds have underperformed cash in 40 out of those 95 years.2
Everything is cyclical.
Everything and everyone underperforms.
This is the essence of risk in the financial markets.
Further Reading:
In the Markets Nothing is as Dependable as Cycles
1The annual returns for Berkshire Hathaway are redonkulous. 11 out of 57 years was a return of 50% or more, basically one out of every 5 years.
23 month T-bills, S&P 500 and 10 year treasuries.

