Bonds are having an amazing year especially in light of where interest rates began the year. The positive thing for investors in bonds is you have some nice gains thus far in 2019. The negative is eventually those short-term gains will lead to lower long-term returns (assuming rate don’t go negative for years to come).
In this Fortune piece, I looked at the various potential scenarios bonds could see from here depending on what happens to interest rates from here.
*******
Bond markets are the surprise winners so far in 2019 in terms of performance numbers. The iShares 7-10 Year Treasury ETF (IEF) is up nearly 13% this year. Longer-term bonds are up even more, with the iShares 20+ Year Treasury Bond ETF (TLT) rising nearly 22% in 2019.
The reason for outsized gains in the bond market this year stems from the simple fact that interest rates have fallen dramatically. The 20-year treasury yield has fallen from nearly 3% to start the year to 1.8%. The 10 year is down to 1.6% from a starting point of 2.7% in January.
Bond prices and interest rates are inversely related, so falling yields have been a boon to bondholders. What has many prognosticators worried these days is what happens if and when this trend reverses. With rates being so low these days, it won’t take much of a rise in rates to eat up the entire yield for many bonds.
Duration is an approximate measure of a bond’s sensitivity to interest rate movements. A good rule of thumb is that you can expect a bond to rise or fall by its duration for every 1% move up or down in interest rates.
For example, the current effective duration is 17.3 for TLT and 7.5 for IEF. This means investors in TLT could expect to lose approximately 17% for every 1% rise in interest rates. For investors in IEF, they should expect to lose 7.5% or so for every 1% move higher. Those are enormous losses for bondholders.
With the number of negative-yielding bonds around the globe growing by the day, investors are worried a rising rate environment could spell doom for their fixed-income assets and wipe out the wonderful gains they’ve accrued this year.
There are really only three scenarios for bond investors in terms of interest rates—they could rise, fall or stay roughly where they are. Here’s how this could play out.
The best-case scenario
I know the losses I just laid out may look scary but the best-case scenario for long-term investors is for interest rates to rise. This is because expected returns for bonds are highly correlated with starting yields.
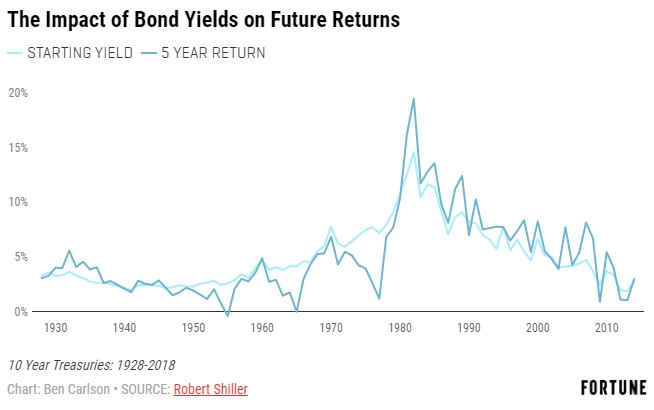
The correlation of starting yields and subsequent 5 year returns for 10 year treasury bonds in 0.87. Go out to 10 years and the correlation moves up to 0.95. So while there would be some pain in the short-term in the form of bond prices falling, over the long haul, higher rates are a good thing for bondholders because it means higher expected returns in the future.
In the short-term, a further drop in rates would lead to even higher bond prices. But long-term investors in fixed income should hope for higher rates.
The worst-case scenario
In 1950, the 10 year treasury yield was just 2.3%. Over the next three-plus decades, it would rise sixfold, culminating in a 14.6% yield in 1981. With interest rates up so much you would assume bondholders got destroyed. Actually, the nominal returns weren’t all that bad.
The 10 year treasury bond returned nearly 150% from 1950-1981, good enough for an annual return of roughly 3% per year. That’s not an extraordinary return by bond bull market standards but it’s not as bad as many would assume. The reason for this is because those higher rates eventually translated into higher returns.
The downside of this period was not rising rates, but the reason for the rise in rates—inflation. Inflation is by far the biggest risk in high-quality bonds because it eats away at your purchasing power over time. From 1950-1981, inflation ran at an annual run rate of 4.3%.
So while 10 year treasuries may have been positive on a nominal basis, they lost almost 40% of their value on a real basis, after accounting for inflation. The worst case scenario for a short-term bond investor is a short-term bounce in rates. But the worst case for a long-term bond investor is higher than expected inflation.
The muddle through scenario
The middle ground here would be a situation where rates stay in a tight range for the foreseeable future. There is a precedent for this.
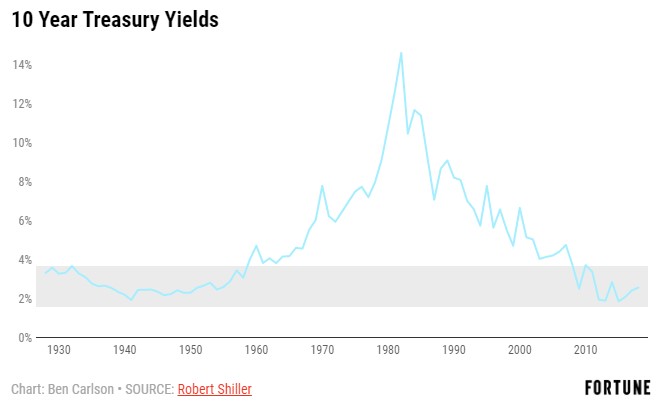
From the late-1920s well into the 1950s, rates remained in a range of roughly 2% to 4% and didn’t break out until closer to the 1960s. 10 year bonds returned roughly 4% per year from 1928-1957. Inflation ran at just 1.6% per year in this time so real returns were still positive.
There no easy answers for bond investors right now. Short-term traders have likely latched on to bonds to take advantage of the trend downward in rates. Eventually that will have to reverse or level out. But long-term investors need to understand that expected returns from current levels should come close to matching current yields.
Don’t get used to the huge returns we’ve seen in 2019. They won’t last forever.
This piece was originally published at Fortune. Re-posted here with permission.

