On Monday the S&P 500 closed at a little more than 4,100.
That’s a level the index first hit in May 2021.
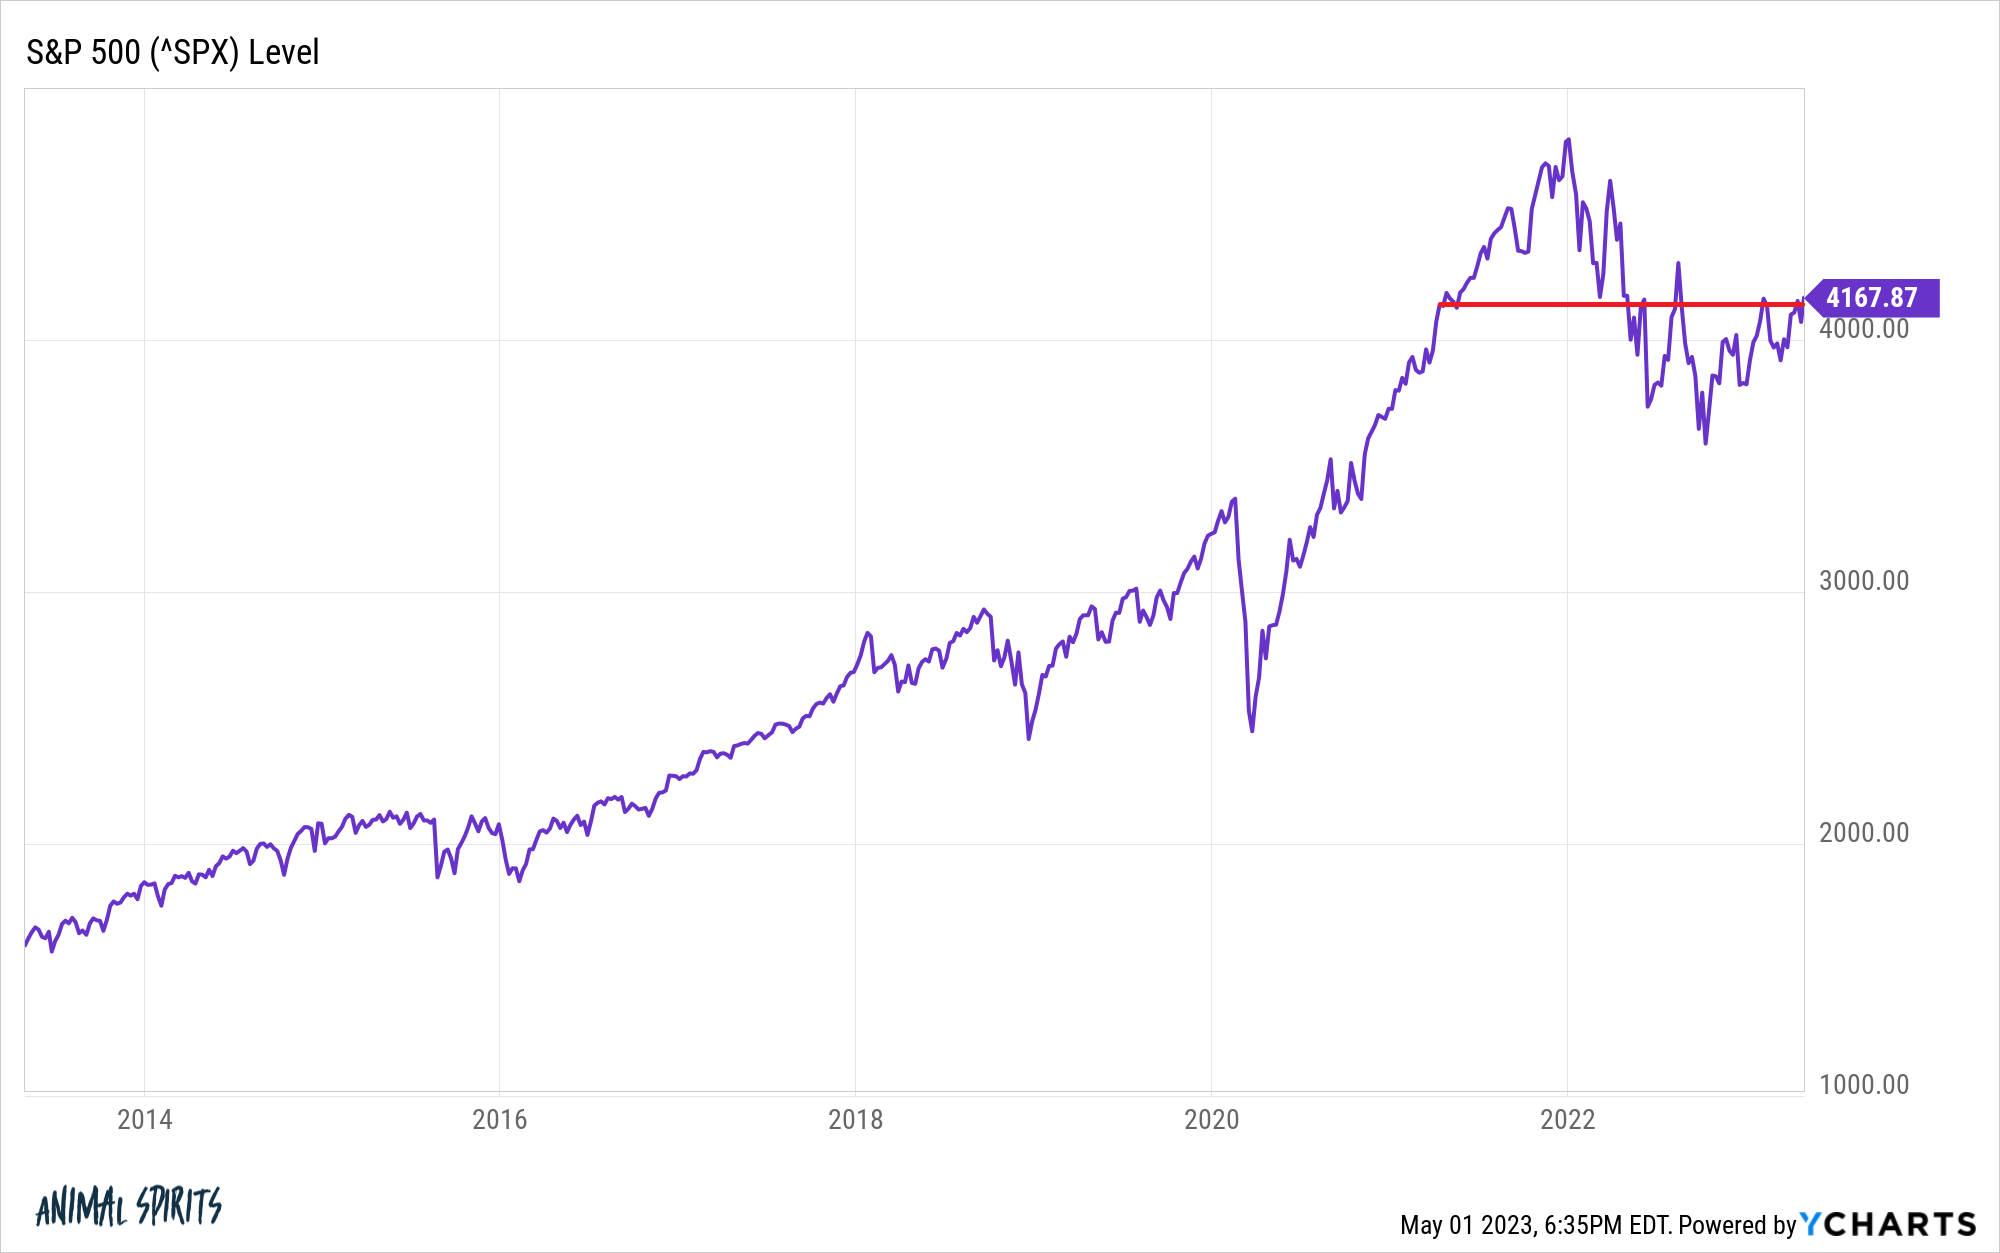
A lot has changed in the intervening two years from a market perspective.
This is a snapshot of how things looked back in May 2021:
- Fed funds rate: 0% (on the floor)
- 10 year treasury yield: 1.6% (generationally low)
- Inflation rate: 4.2% (uncomfortable but still felt transitory)
- Mortgage rates: 3.0% (ridiculously low)
- S&P 500: 4,100 or so (felt pretty good)
And here’s how things look now:
- Fed funds rate: 4.75% (way higher)
- 10 year treasury yield: 3.6% (way higher)
- Inflation rate: 5.0% (higher but getting better)
- Mortgage rates: 6.7% (doesn’t feel great)
- S&P 500: 4,100 or so (depends on who you ask)
Interest rates are up a lot. Inflation is up even though it’s been trending down.
You would assume, all else equal, that much higher interest rates and price levels would have had a far greater impact on the stock market.
Don’t get me wrong — we’ve had a nice little bear market. And this kind of snapshot approach to looking at market indicators can be misleading.
But if you were to tell investors two years ago that we were about to enter one of the most aggressive Fed hiking cycles in history combined with inflation reaching 9%, most would have assumed things would be a lot worse.1
At the very least you would expect higher rates to exert downward pressure on stock prices and valuations.
A higher discount rate should make today’s prices and thus valuations lower if you’re using a simple present value of future cash flows model.
I wanted to put this theory to the test by segmenting historical valuations by different inflation and interest rate regimes.
Using Robert Shiller’s historical CAPE ratio data, I calculated average valuations by different levels of inflation going back to 1928:
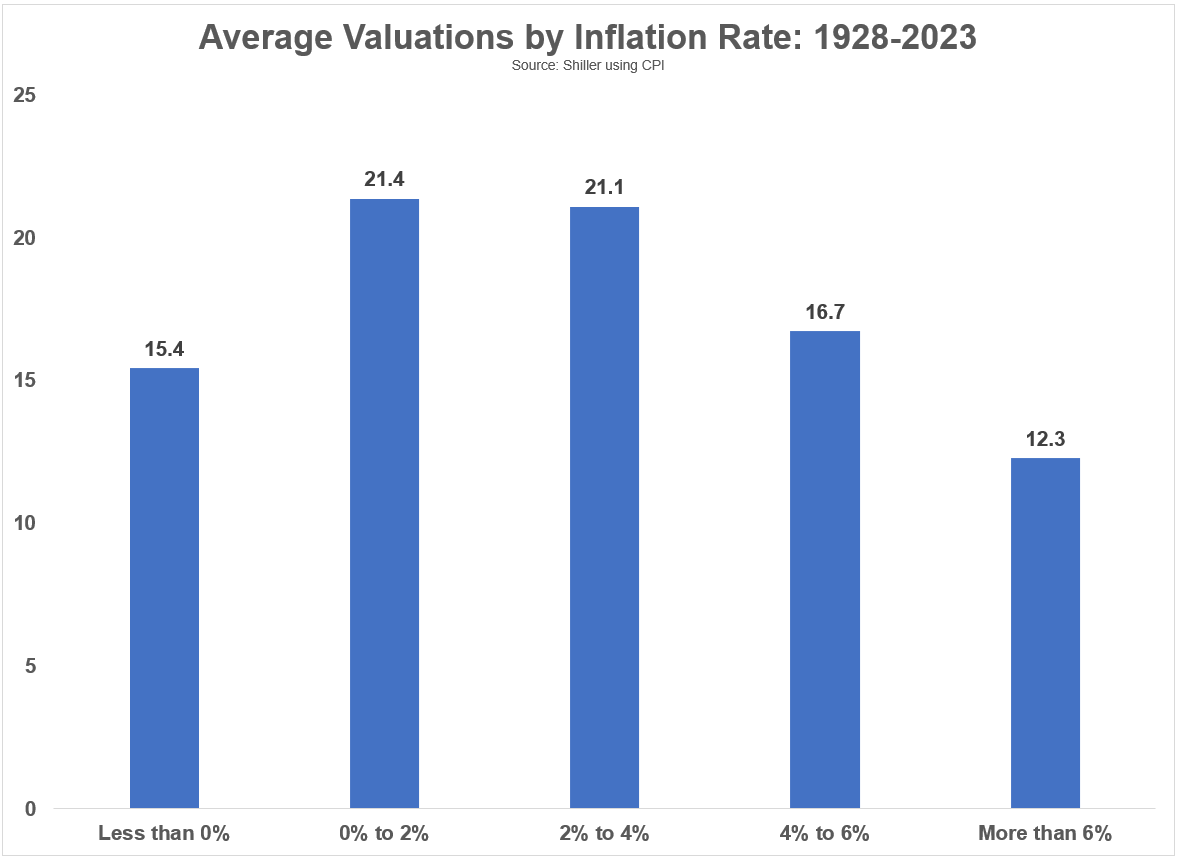
This trend makes sense intuitively. The higher the inflation rate, the lower the valuation averages.2
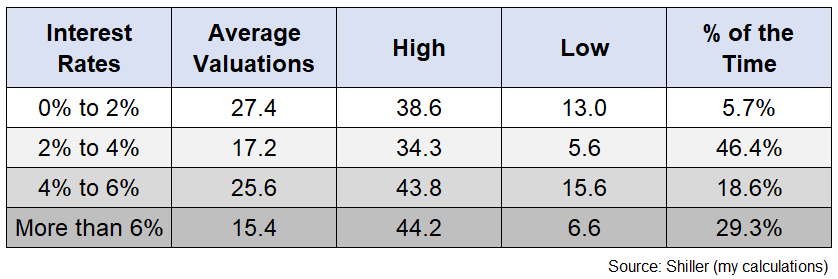
The relationship between interest rates and valuations is not quite as clearcut:
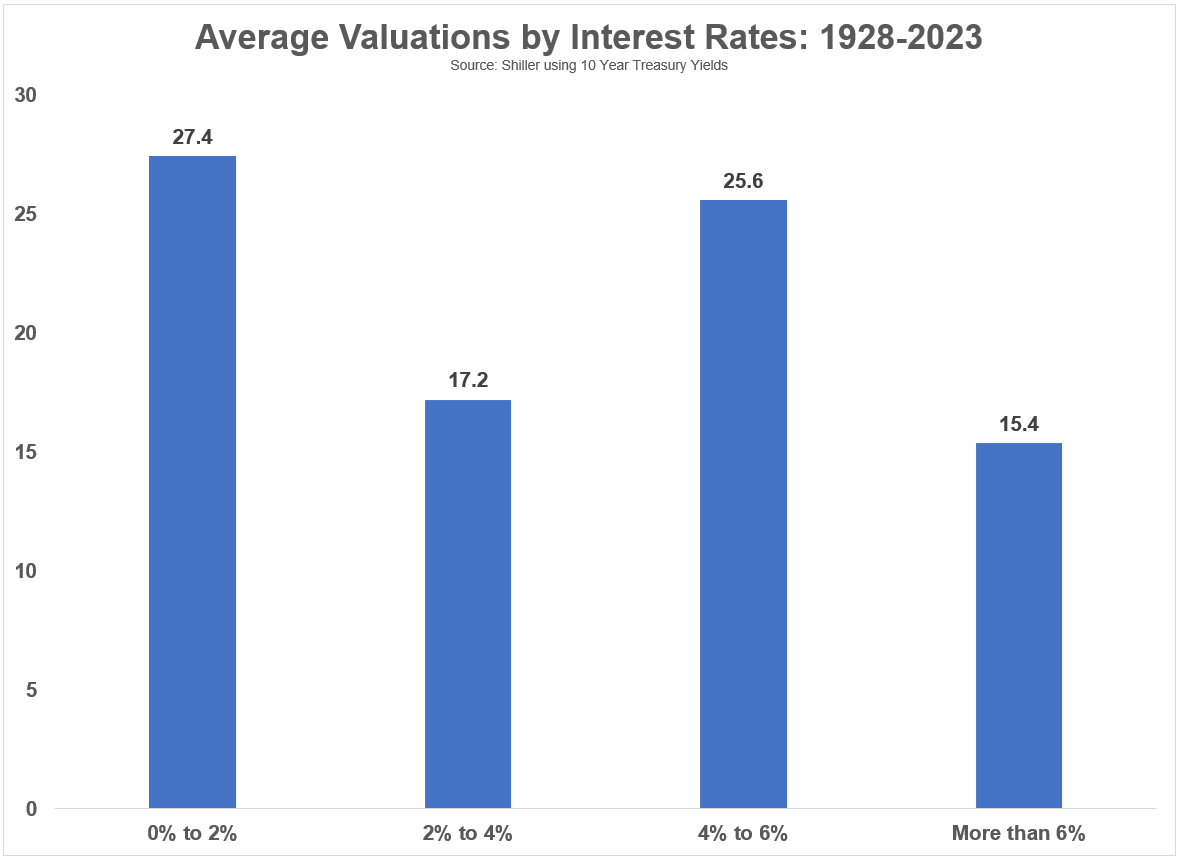
Ultra-low rates have been associated with much higher valuations and ultra-high rates have been associated with much lower valuations but it’s a mixed bag in the middle.
So if inflation and rates are way higher why is the CAPE ratio still around 29x? Shouldn’t it be lower?
Part of the reason the CAPE isn’t lower probably has to do with the fact that it’s a 10 year moving average so it’s not going to fall off a cliff unless the stock market crashes in short order.
But it’s also true that long-term averages can be a bit misleading at times.
Averages can give you a general sense of how markets behave under certain conditions but there is usually a wide range of results around those averages.
For instance, here is a further breakdown of inflation rate levels that includes the range of results as well as the sample size:
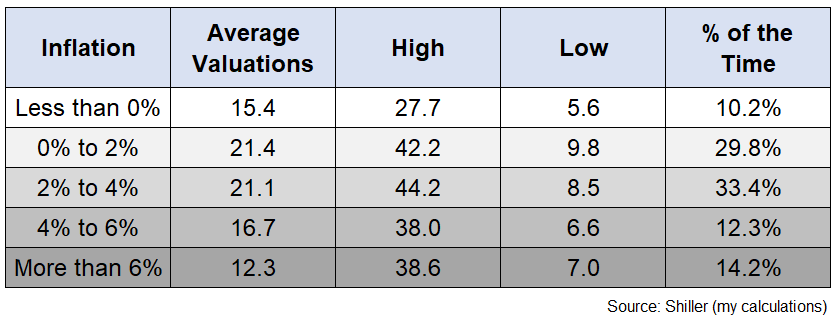
There is a trend in the long-run averages but over the short-run anything can happen. Depending on the inflation rate, we have seen both ungodly high valuations and insanely low valuations.
The same is true when you break things down by interest rate levels:
There have been times in the past when interest rates or inflation were your North Star when it comes to valuations.
But there have also been times when valuations didn’t like up with interest rates or inflation rates.
The problem with trying to make sense of the market levels using one or two variables is the stock market is not that simple.
The stock market rarely follows an if-then framework. Just because A occurs does not guarantee B will automatically follow.
There is so much other stuff going on in terms of trends, the economy and how investors are positioned that sometimes the stock market doesn’t make much sense, especially in the short-run.
Maybe this stuff operates on a lag.
Maybe it will be a slow churn if rates remain elevated.
Or maybe inflation will fall and rates will come down.
The problem with trying to predict how the stock market will react to any economic variable is we simply don’t know what’s been priced in or how much investors will over- or under-react to certain pieces of data.
Textbook financial models can be helpful if you want to know how finance should work.
But understanding human psychology can be even more helpful to understand how finance does work.
Markets don’t always react how you think they should because humans are unpredictable at times..
Further Reading:
Short-Term & Long-Term Inflation Trends
1The start and end points matter a lot here obviously since stocks kept going up in 2021 and then fell in 2022.
2Valuations in a deflationary environment were also lower than average but I think that mostly has to do with the fact that deflation occurred more in the past when valuations were lower or when we are in the midst of a nasty recession.

