Some people might think it’s bizarre that turning the page on the calendar should matter to investors.
Why do investment professionals care about the end of a month, quarter or year?
These periods do seem arbitrary but the changing of the calendar from one year to the next offers a good chance for market nerds like myself to update some long-term market data.
This is another one of my favorite long-term stock market charts I track on an annual basis:
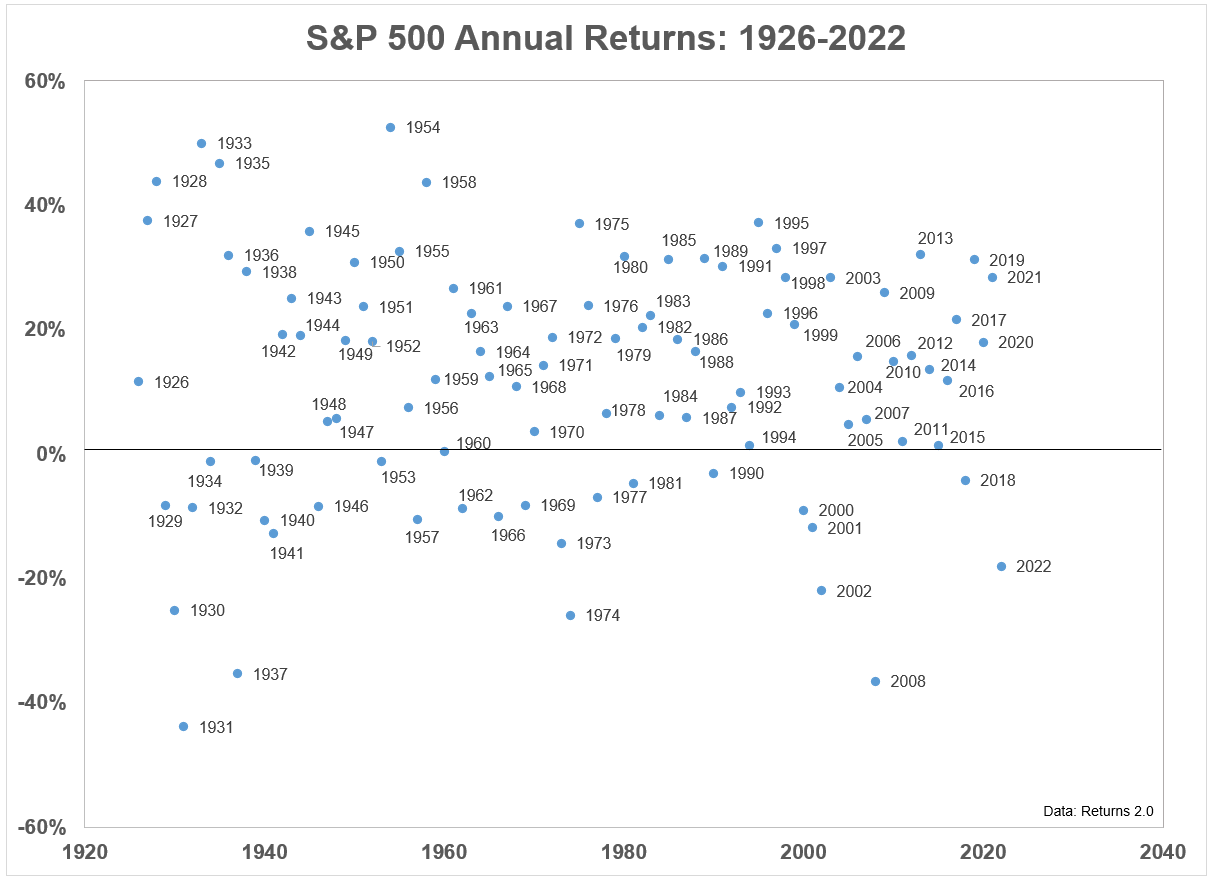
It speaks to the random nature of the stock market and how erratic your experience can be as an investor in risk assets.
Volatility is the name of the game when you invest in stocks.
If you wish to earn long-run returns, you cannot rid yourself of the market’s short-run ups and downs. That’s the trade-off we all make.
You could hold more cash or bonds to dampen your portfolio’s volatility.1
Another option is to extend your time horizon.
While updating my data for the scatterplot of calendar year returns I decided to look at the range of outcomes over longer time frames.
Here are the best and worst annual returns for the S&P 500 over 1, 3, 5, 7, 10, 15, 20 and 30 year periods2 from 1926-2022:
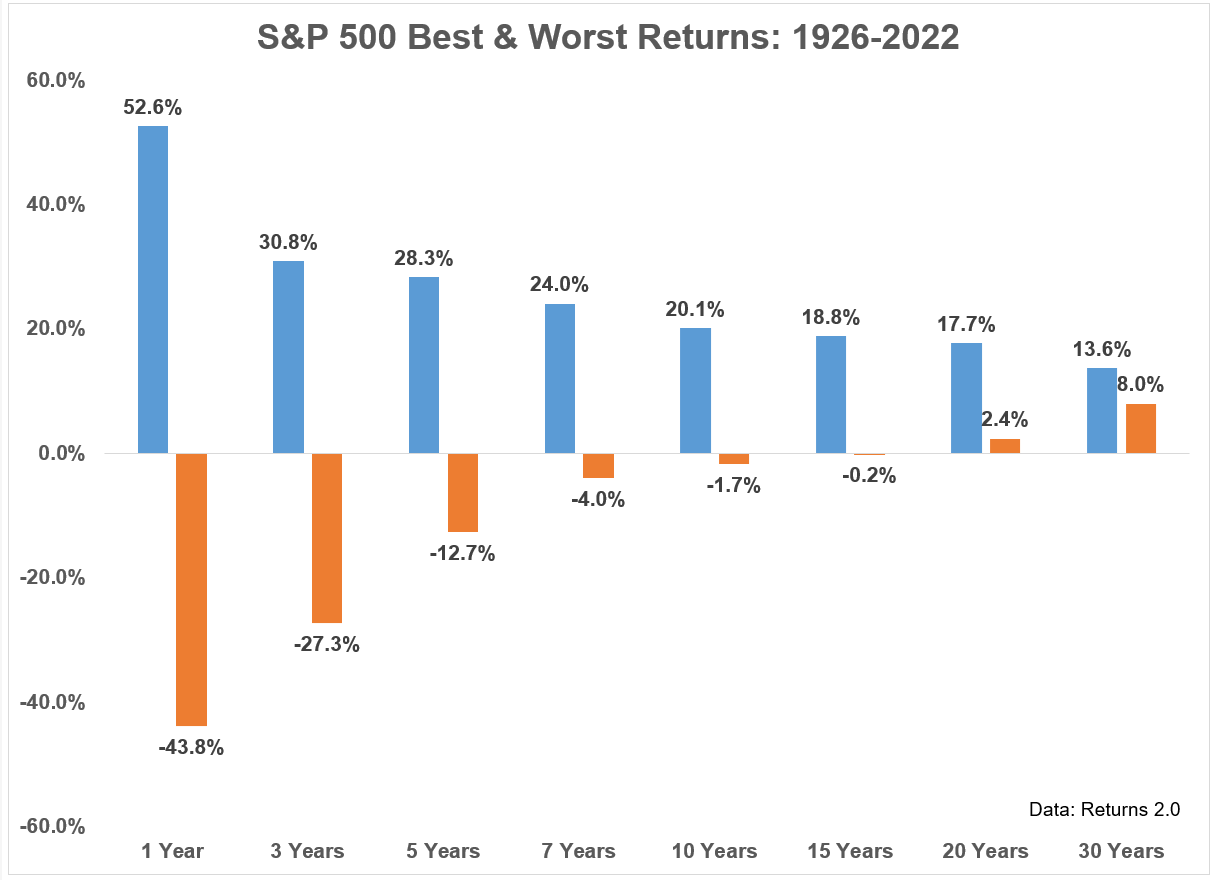
A few things stand out here:
The range of outcomes narrows the further out you go.
There is still a range between very good and very bad outcomes when you look at 10, 15, 20 or 30 year returns but it’s not like the 1, 3 or even 5 year ranges that you could drive a Mack truck through.
You can get crushed over a 1-5 year period. That’s possible but highly unlikely to happen if you hold on for 20-30 years.
You can still have poor outcomes over the long-term but not anything close to the type of bad markets you will see over the short-term.
You’re not guaranteed anything by extending your time horizon. But the historical numbers show the left tail risk of getting annihilated slowly goes away as the years add up.
You could still see your money go nowhere for 10, 15 or even 20 years if you happen to invest at an inopportune moment or experience a soul-crushing crash at the tail-end of your time horizon.
But historical probabilities favor the long-term investor.
More than 75% of 20 year periods have seen annual returns of 8% or more. Almost 96% of the 30 year time frames had annual returns of 9% or more.
Over 30 years that’s a return of more than 1,300% in total. The worst 30 year return was gains of more than 800%!
The stock market’s long-term return profile has more than made up for its occasional deficiencies in the short-term.
Will we see a repeat of these results in the future?
I don’t know.
You could make the case that future stock market returns will be lower than they were in the past (as I did here).
It wouldn’t surprise me if returns came in a bit.3
But I don’t see the relationship between the long-run and short-run experience of investing in the stock market changing anytime soon.
Patience will still be rewarded. Long-term investors will always have a higher probability of success than short-term investors.
The variation in returns will always be higher over days and months than years and decades.
Long-term investing will never be easy but it will remain the best bet for the vast majority of investors to earn solid returns in the stock market.
Further Reading:
Updating My Favorite Performance Chart For 2022
1Bonds didn’t help much last year but are still far less volatile than stocks.
2I calculated these numbers using calendar year returns. Things might look a little better or worse if you used rolling monthly returns but this is close enough.
3It’s also true that it was nearly impossible to earn the market’s return in most of the past 9-10 decades because trading costs were so high and index funds didn’t exist until the 1970s.

