One of my pet theories I’ve been talking about for a number of years on this blog is the idea that markets are moving faster than ever before.
Some combination of improved technology, the free flow of information, a more globalized marketplace and central bank intervention all mean markets seem to go up and down faster than they did in the past.
Just look at how fast mortgage rates went up when once it became apparent the Fed had no choice but to raise interest rates to fight inflation:
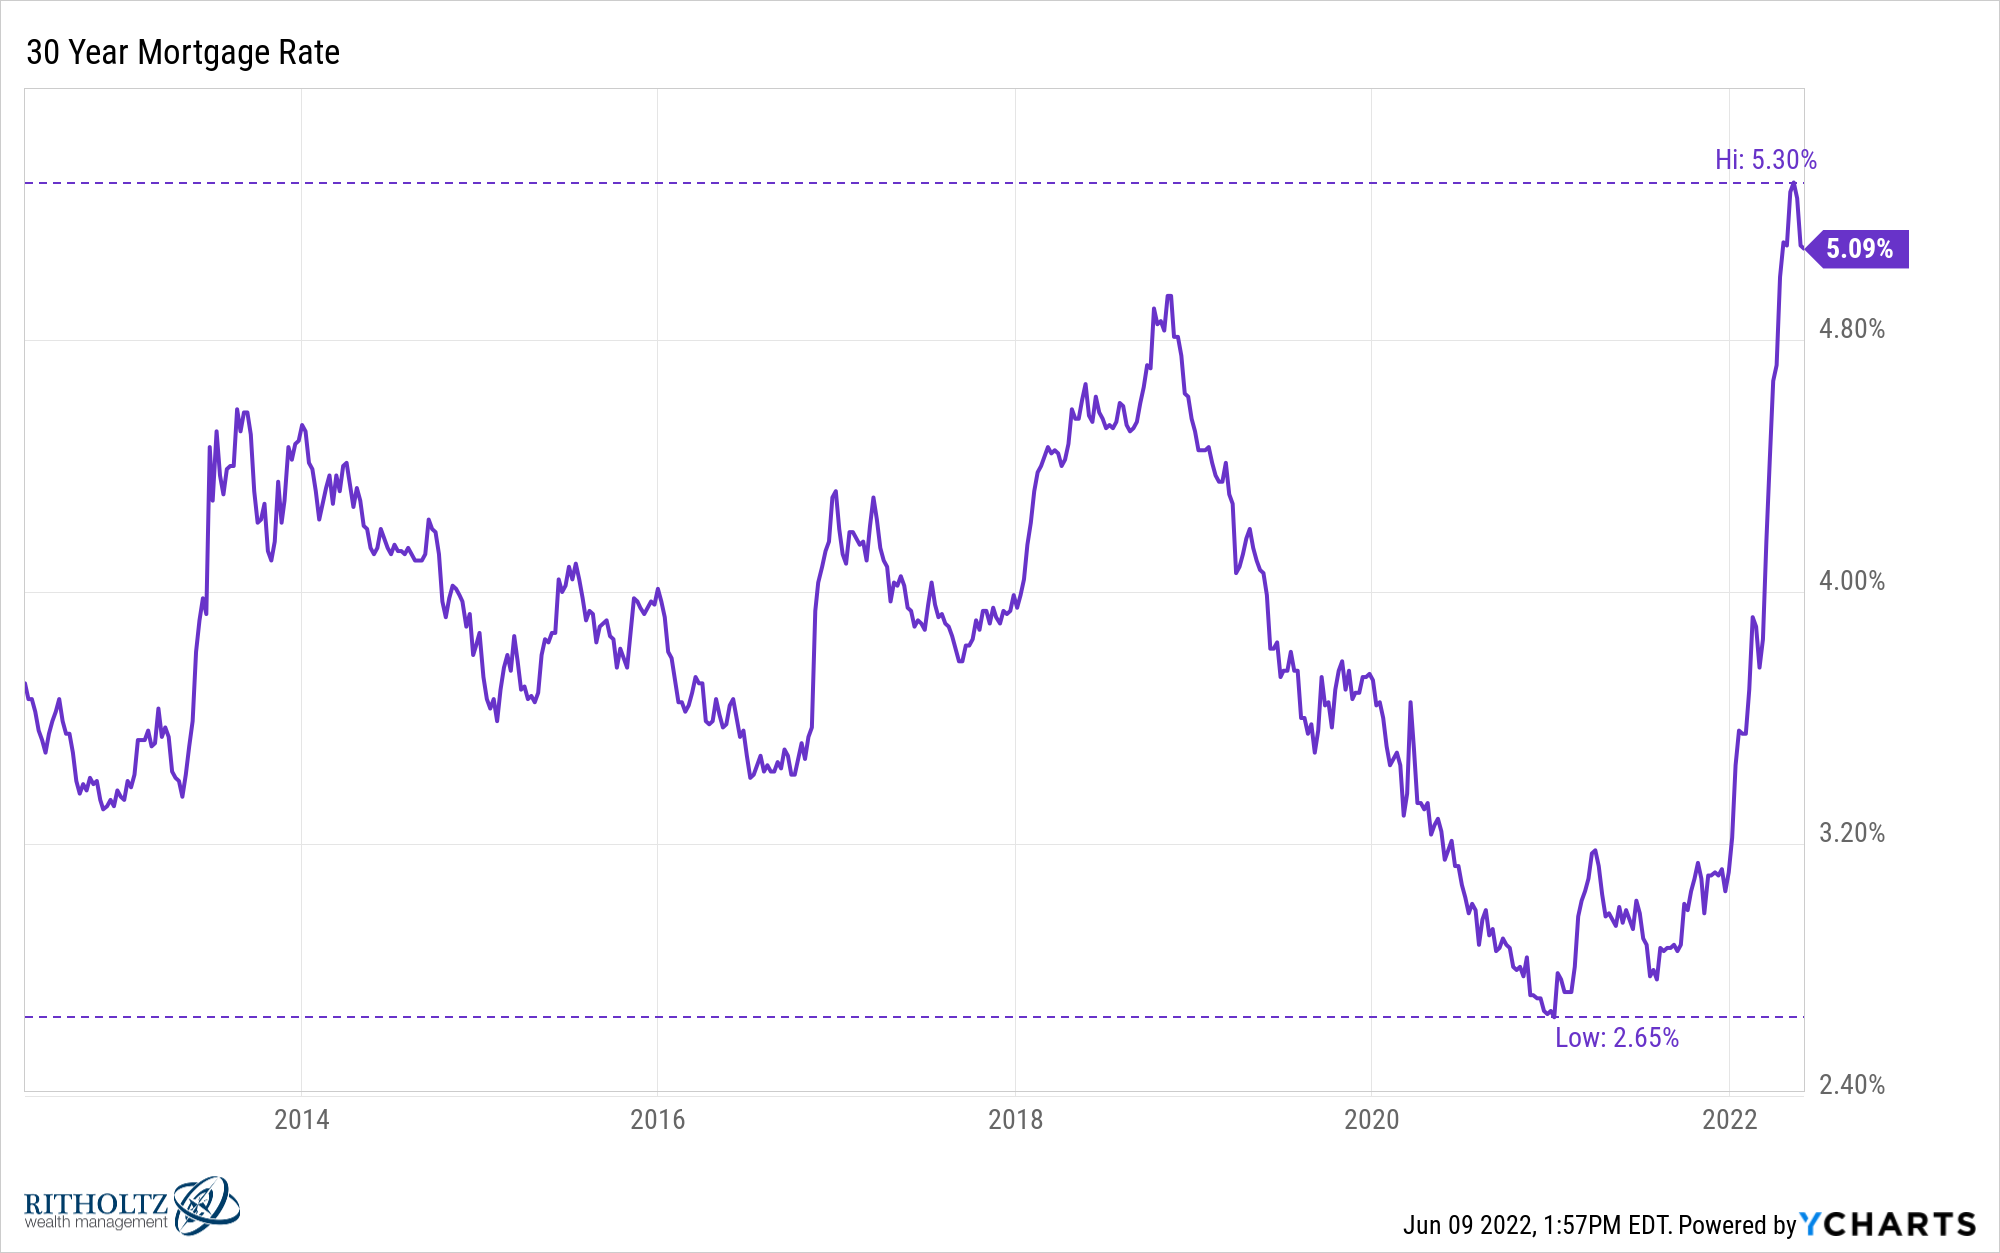
While the Fed is slowly raising the Fed Funds Rate, mortgage rates didn’t want to wait around for Jerome Powell.
Rates went from 3% in January to more than 5% by April. And the move higher was basically uninterrupted.
The only period in history that comes even close to matching the speed and magnitude of this move was in the early 1980s.
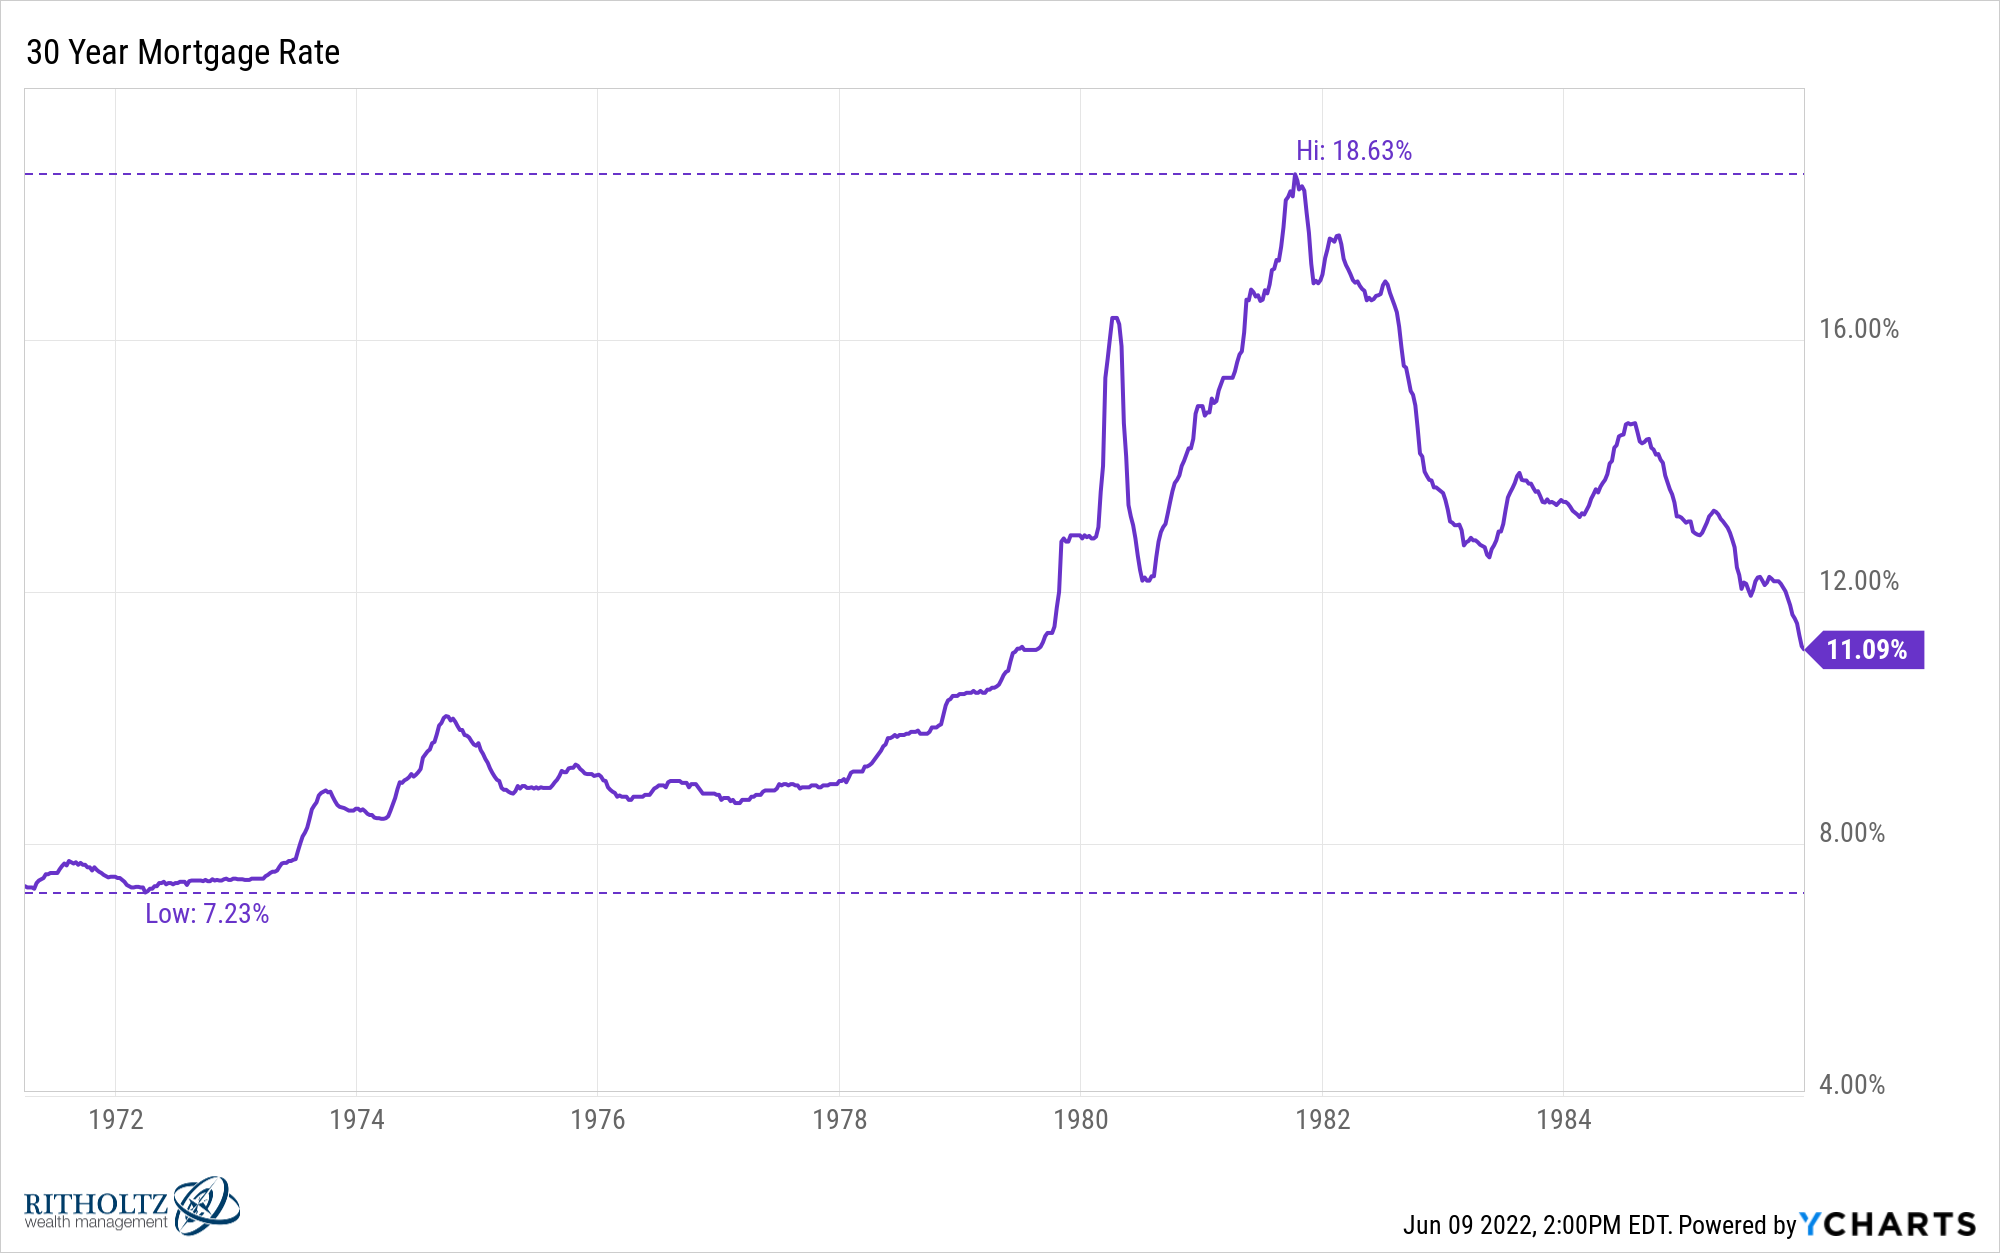
From February 1980 to April 1980 the 30 year mortgage rate went from around 12% to more than 16%. Then from July 1980 to October 1980, rates shot up from 12% to more than 18%.
Interestingly enough though, the magnitude of the move this time has been greater in terms of the percentage gain from the lows.
Rates are up almost 100% from the lows of January 2021 and two-thirds higher than rates from the start of this year.
In 1980/81/82 rates rose 33% and 50%, respectively (admittedly from much higher starting points).
The bad news is the combination of insane price gains and higher mortgage rates means housing has become unaffordable for new buyers:
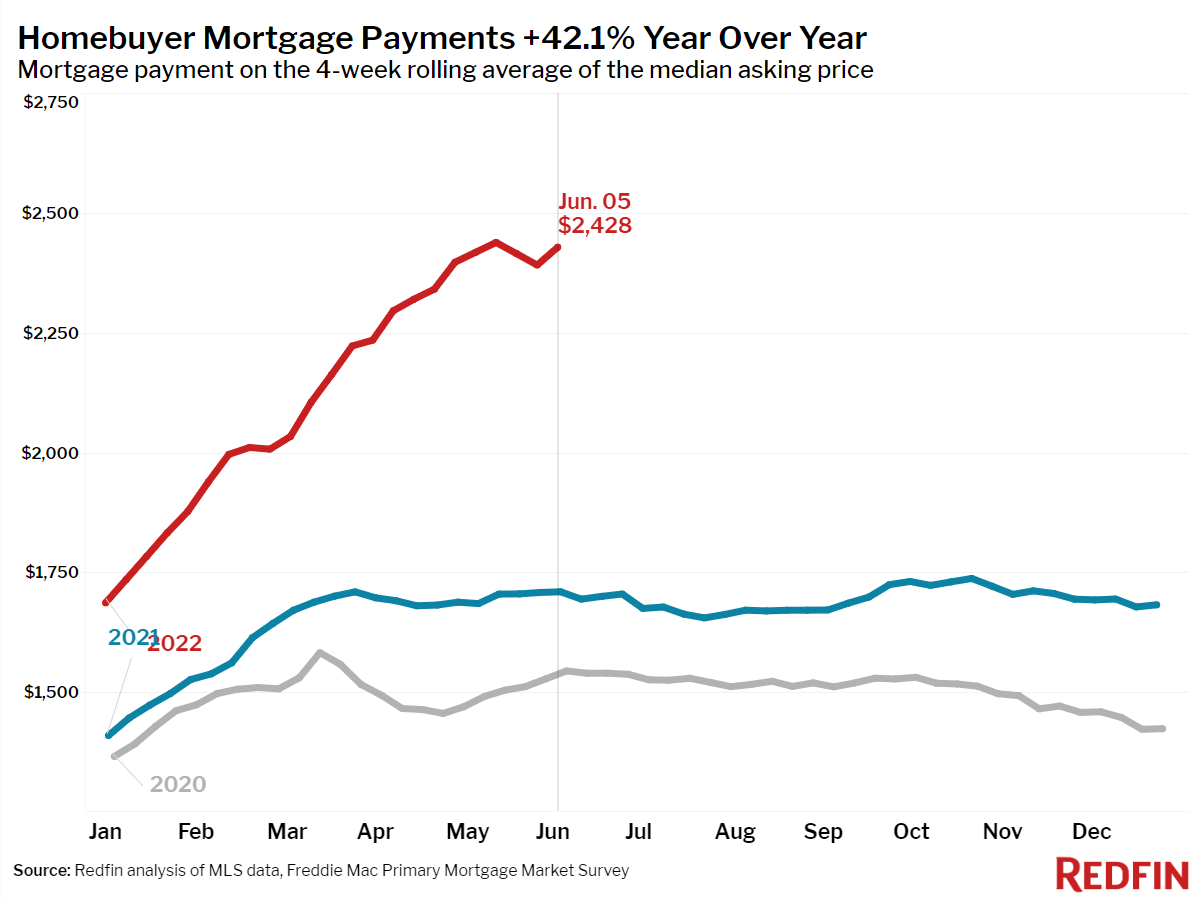
Mortgage calculators probably have more four-letter words hurled at them these days than the Warriors players at a Celtics home game.
The good news is higher rates are bringing some sanity back to the housing market.
My go-to sources for all things housing data throughout this crazy period are RedFin, Mike Simonsen, Logan Motashami and Bill McBride.
Let’s dig into some of their data to show how things are (finally) improving.
Houses shouldn’t go on the market and have multiple offers over the asking price. There should be some give and take to find a market clearing price.
So it’s good to see price reductions rising:
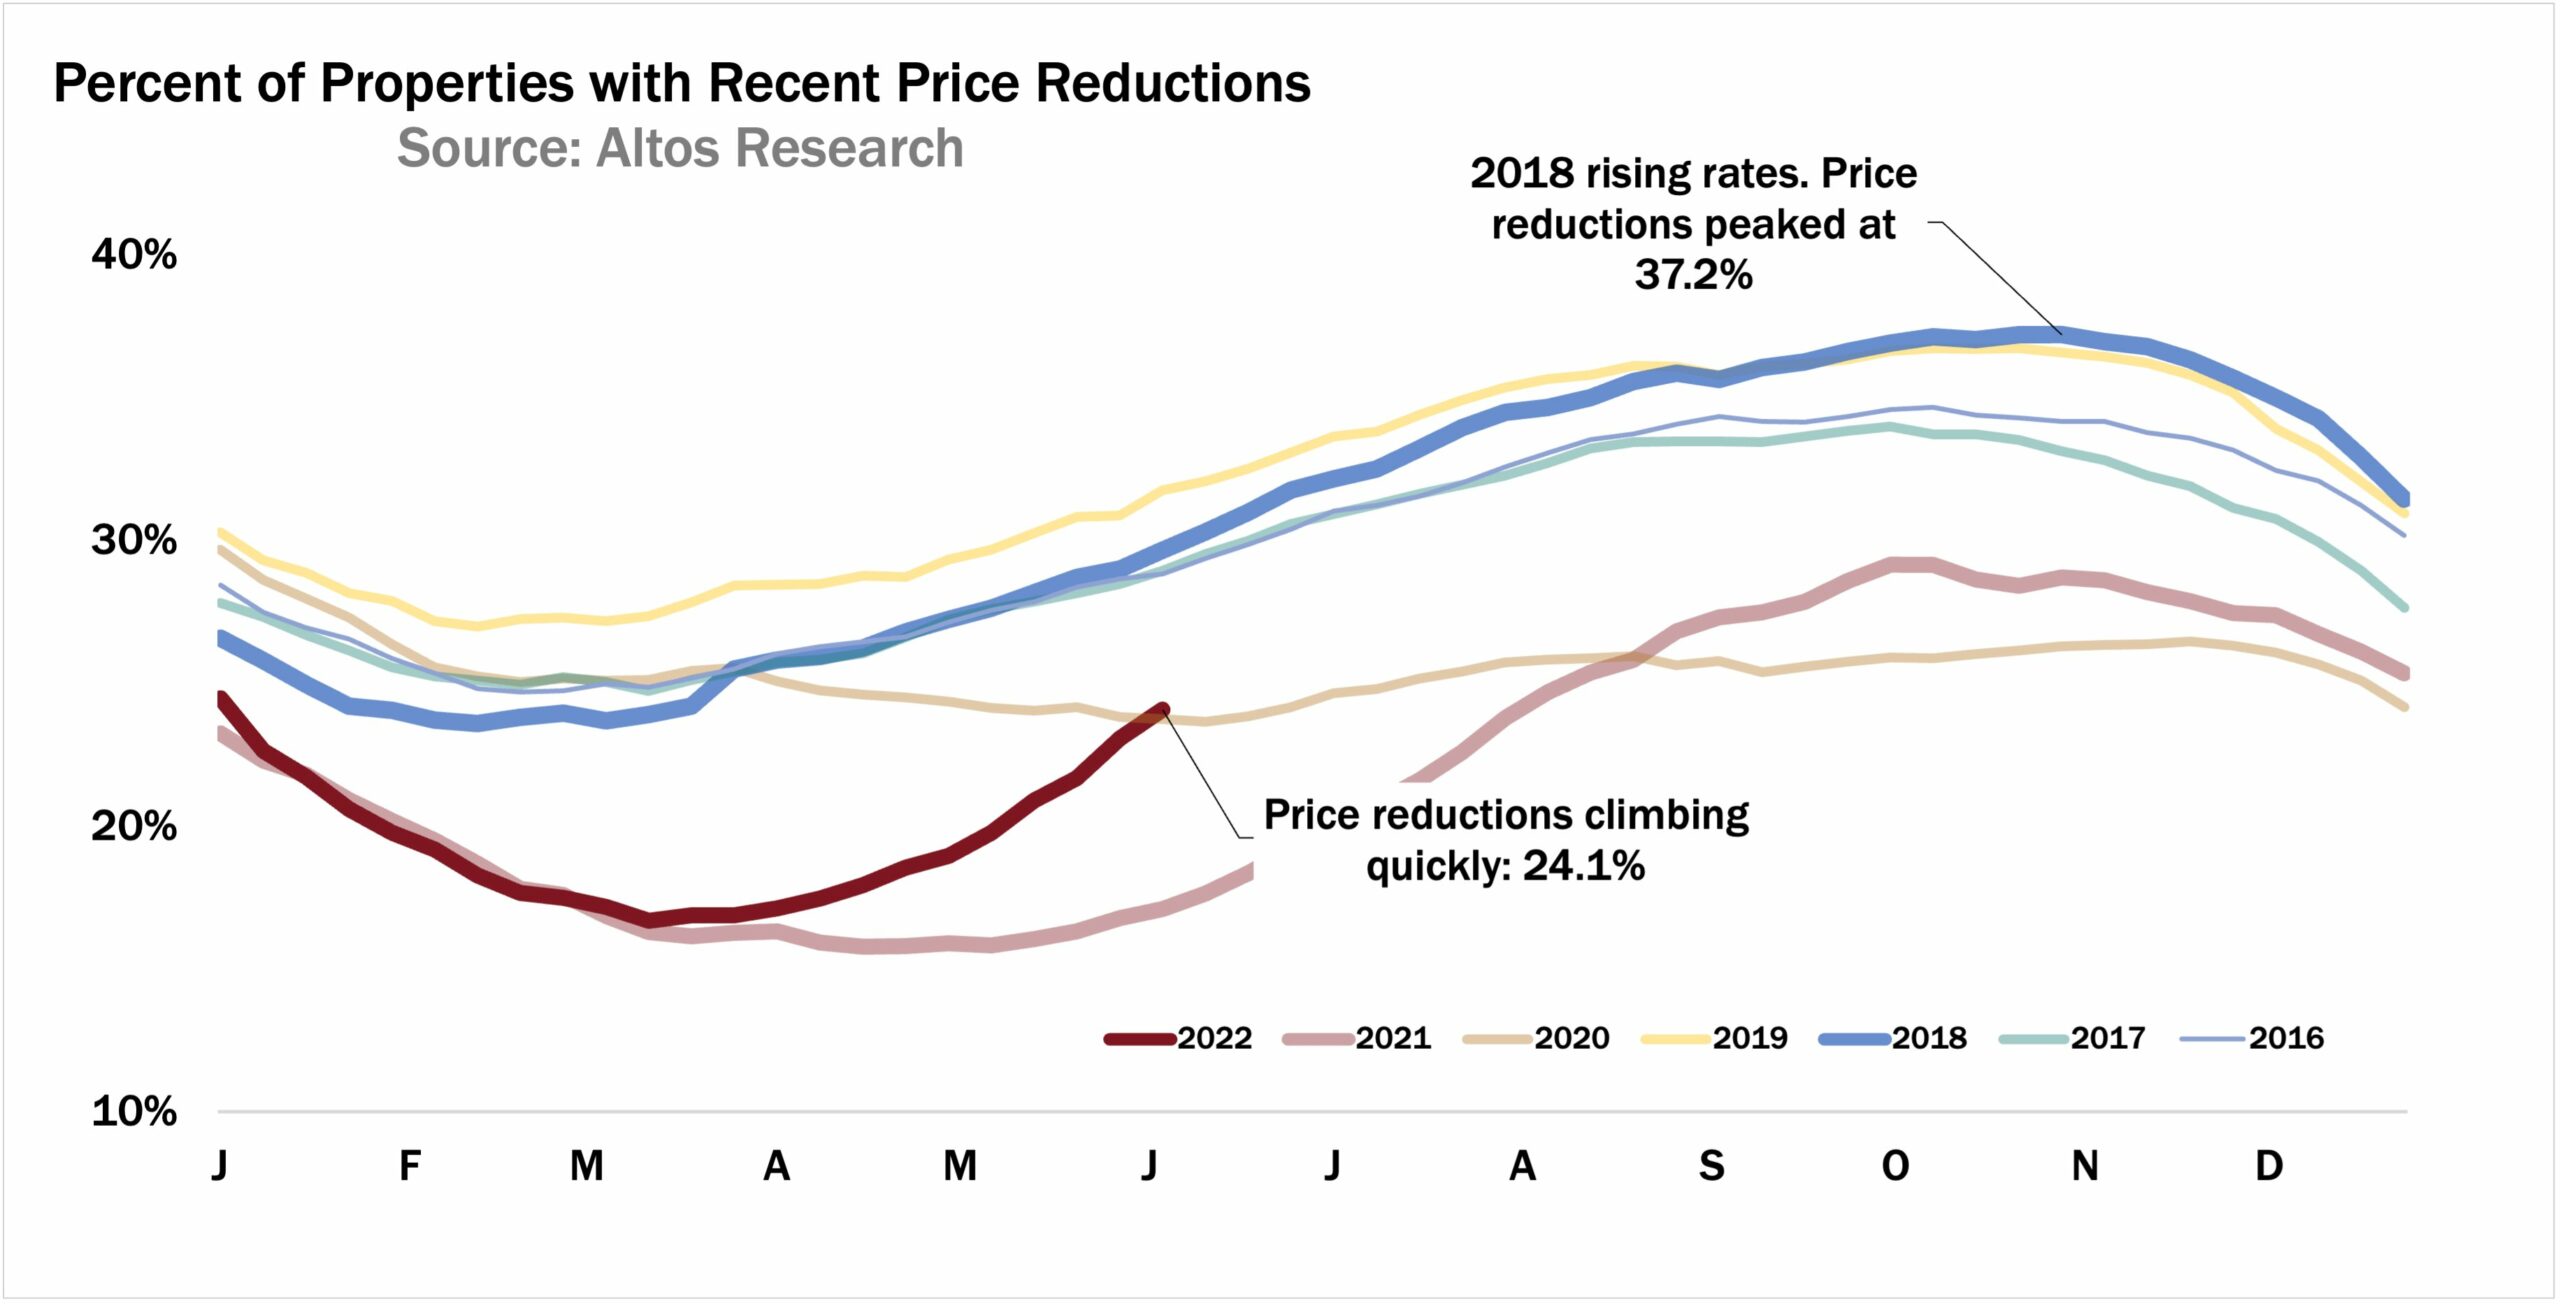
People who own a home have such a large equity cushion right now that they have the ability to drop the price if it’s not selling right away.
This is normal since there are many sellers who assume their home is worth more than it actually is.
Houses also shouldn’t sell the minute they get listed on Zillow. Buyers shouldn’t feel rushed into the most important financial decision of their lives. It wasn’t normal for so many houses to sell so quickly:
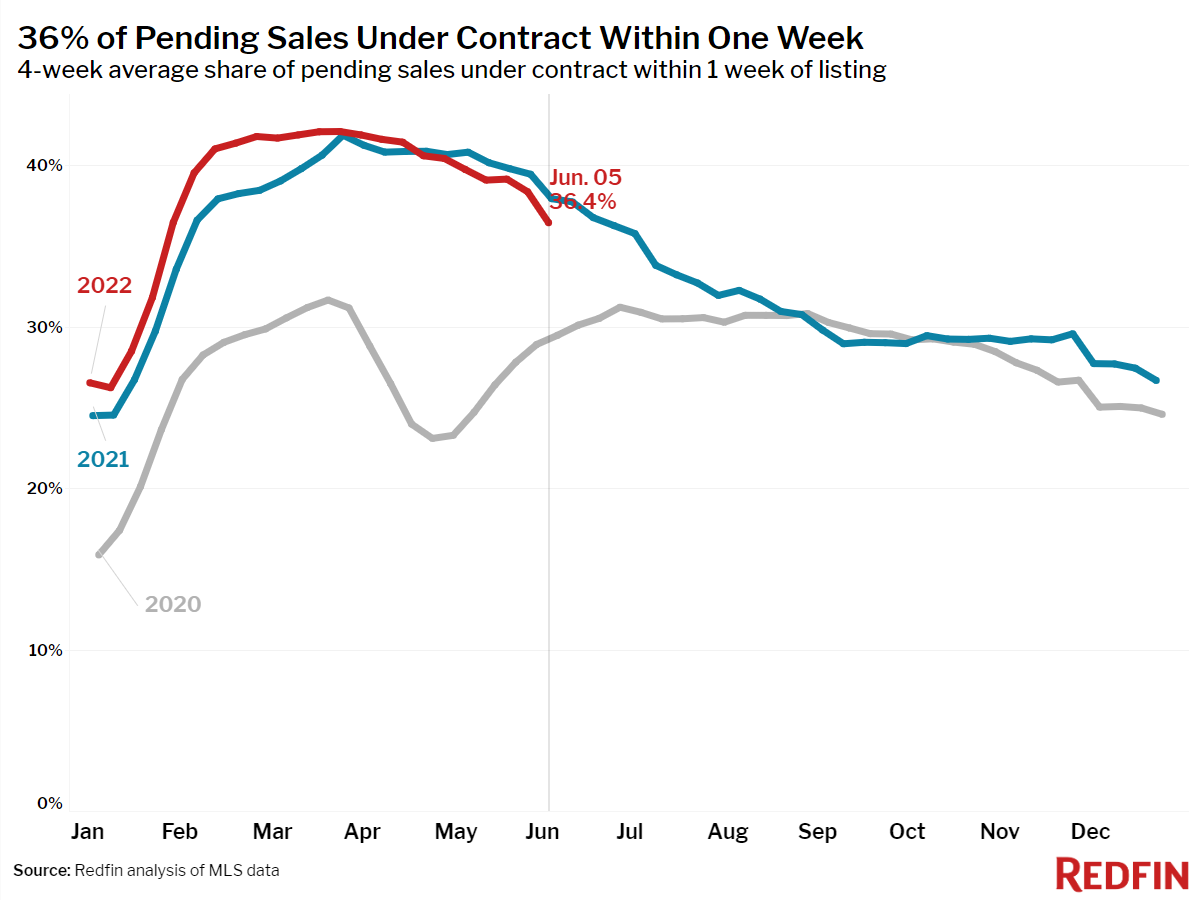
This is still elevated but now heading in the right direction.
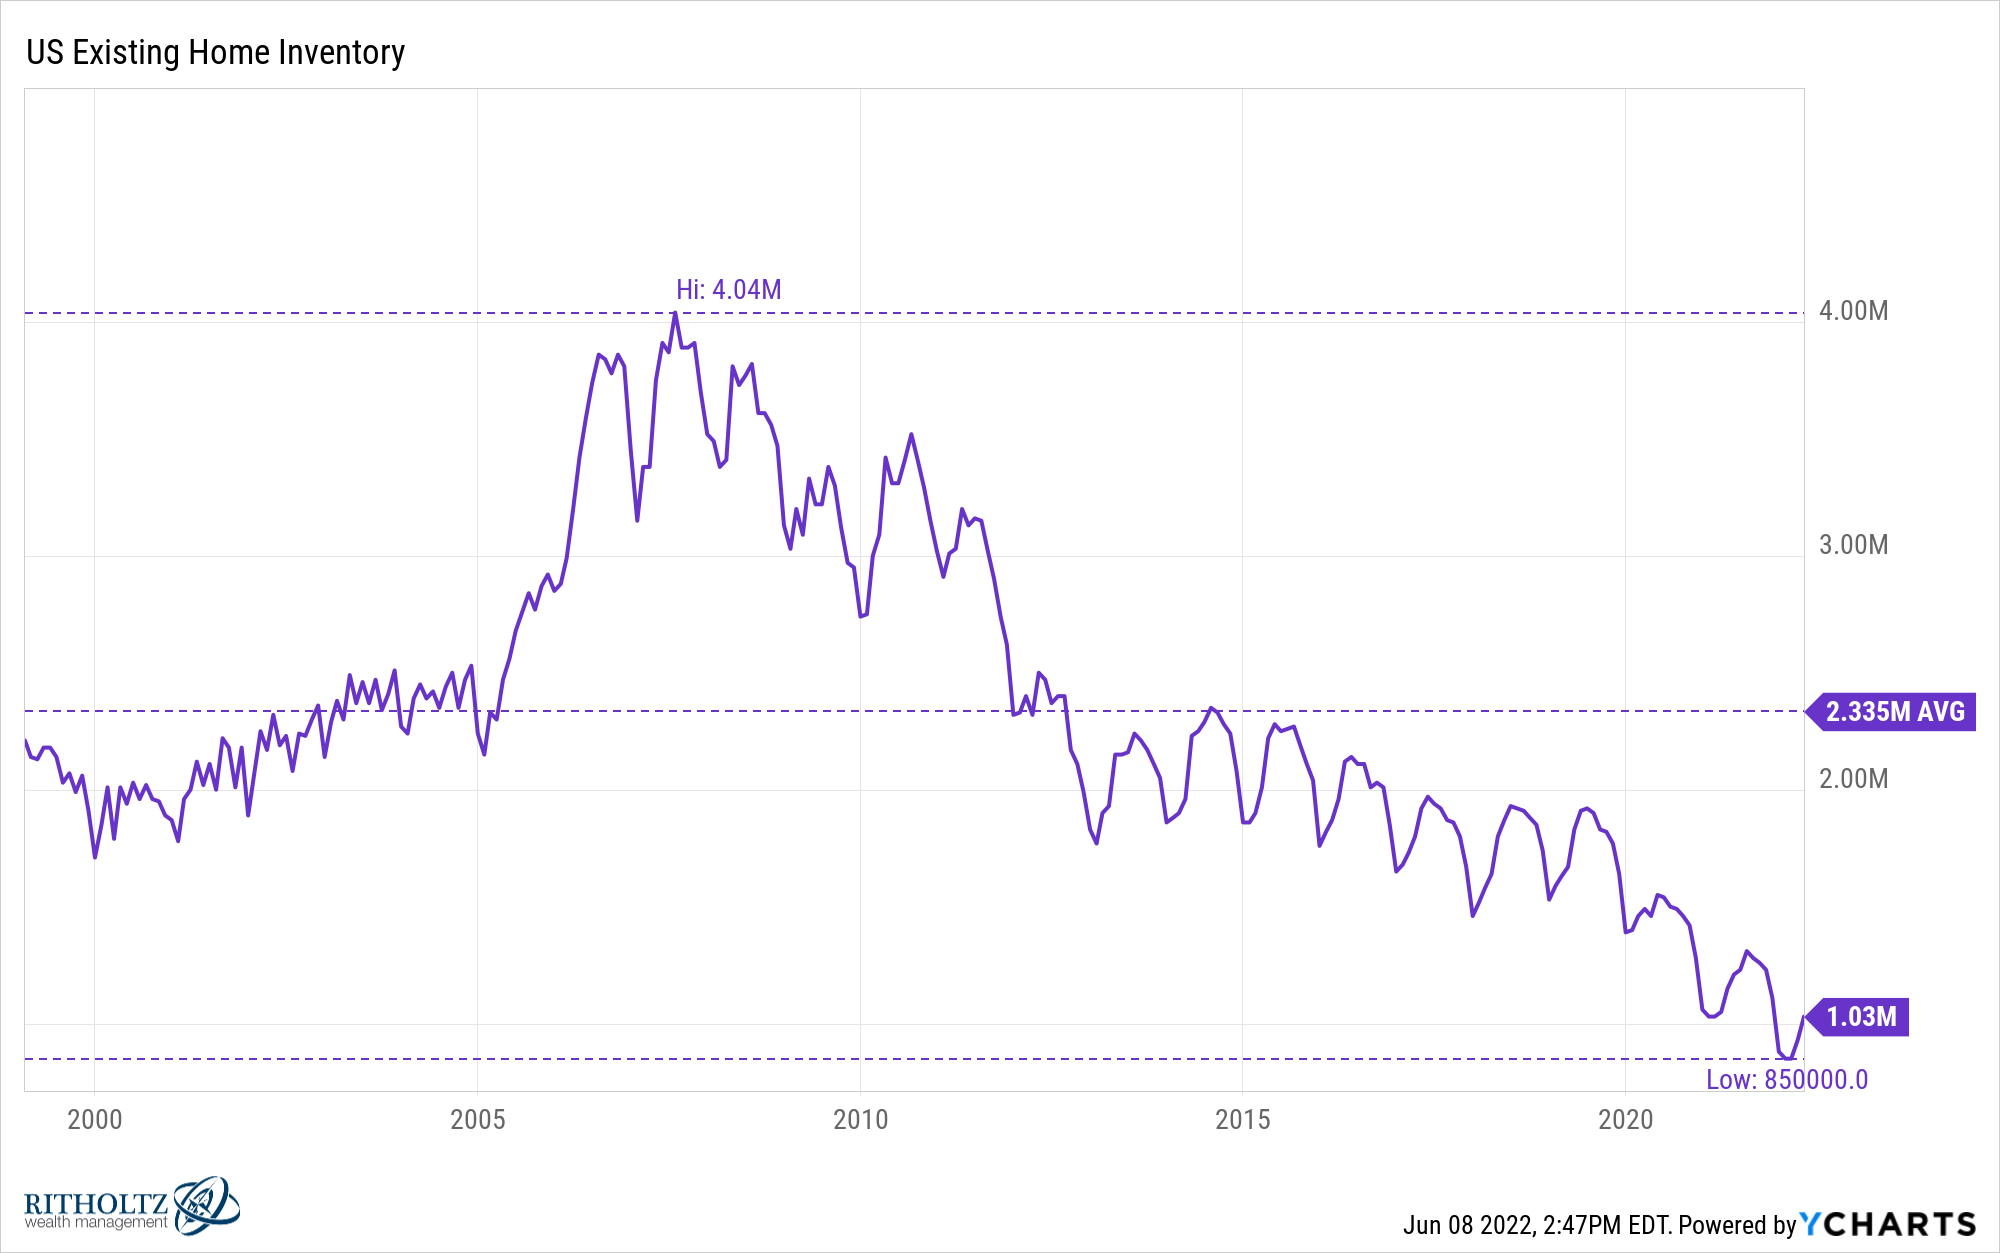
One of the biggest reasons housing has been flying off the shelves so fast is because inventory has been so low. We didn’t build enough houses, people were afraid to list their homes during a pandemic and low interest rates gave people an excuse to bid up the price of the homes that were on the market.
The inventory picture seems to be improving as well as we finally saw a jump in the number of homes for sale:
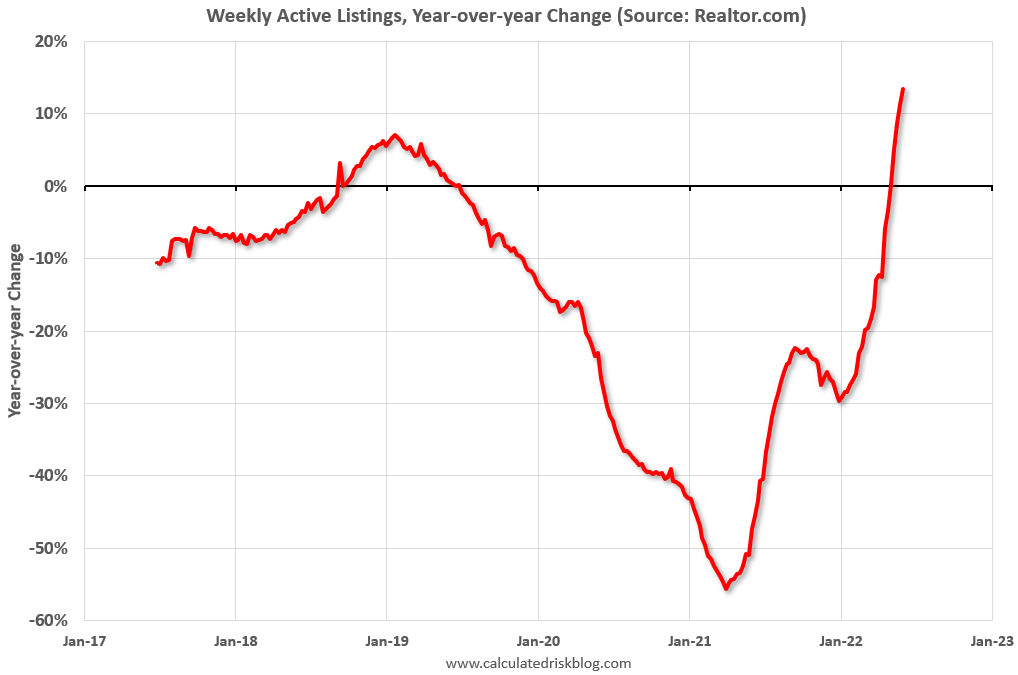
Inventory is up 13% year over year. Another chart moving in the right direction for the first time in a while.
Of course, it’s worth pointing out that much of this improvement is going from atrocious to horrendous.1 A lot of this is buyers sitting out with higher rates but it’s nice to see a greater pool of houses for those who have to buy.
While it’s nice to see inventories rise the most important number for most homebuyers will be price:
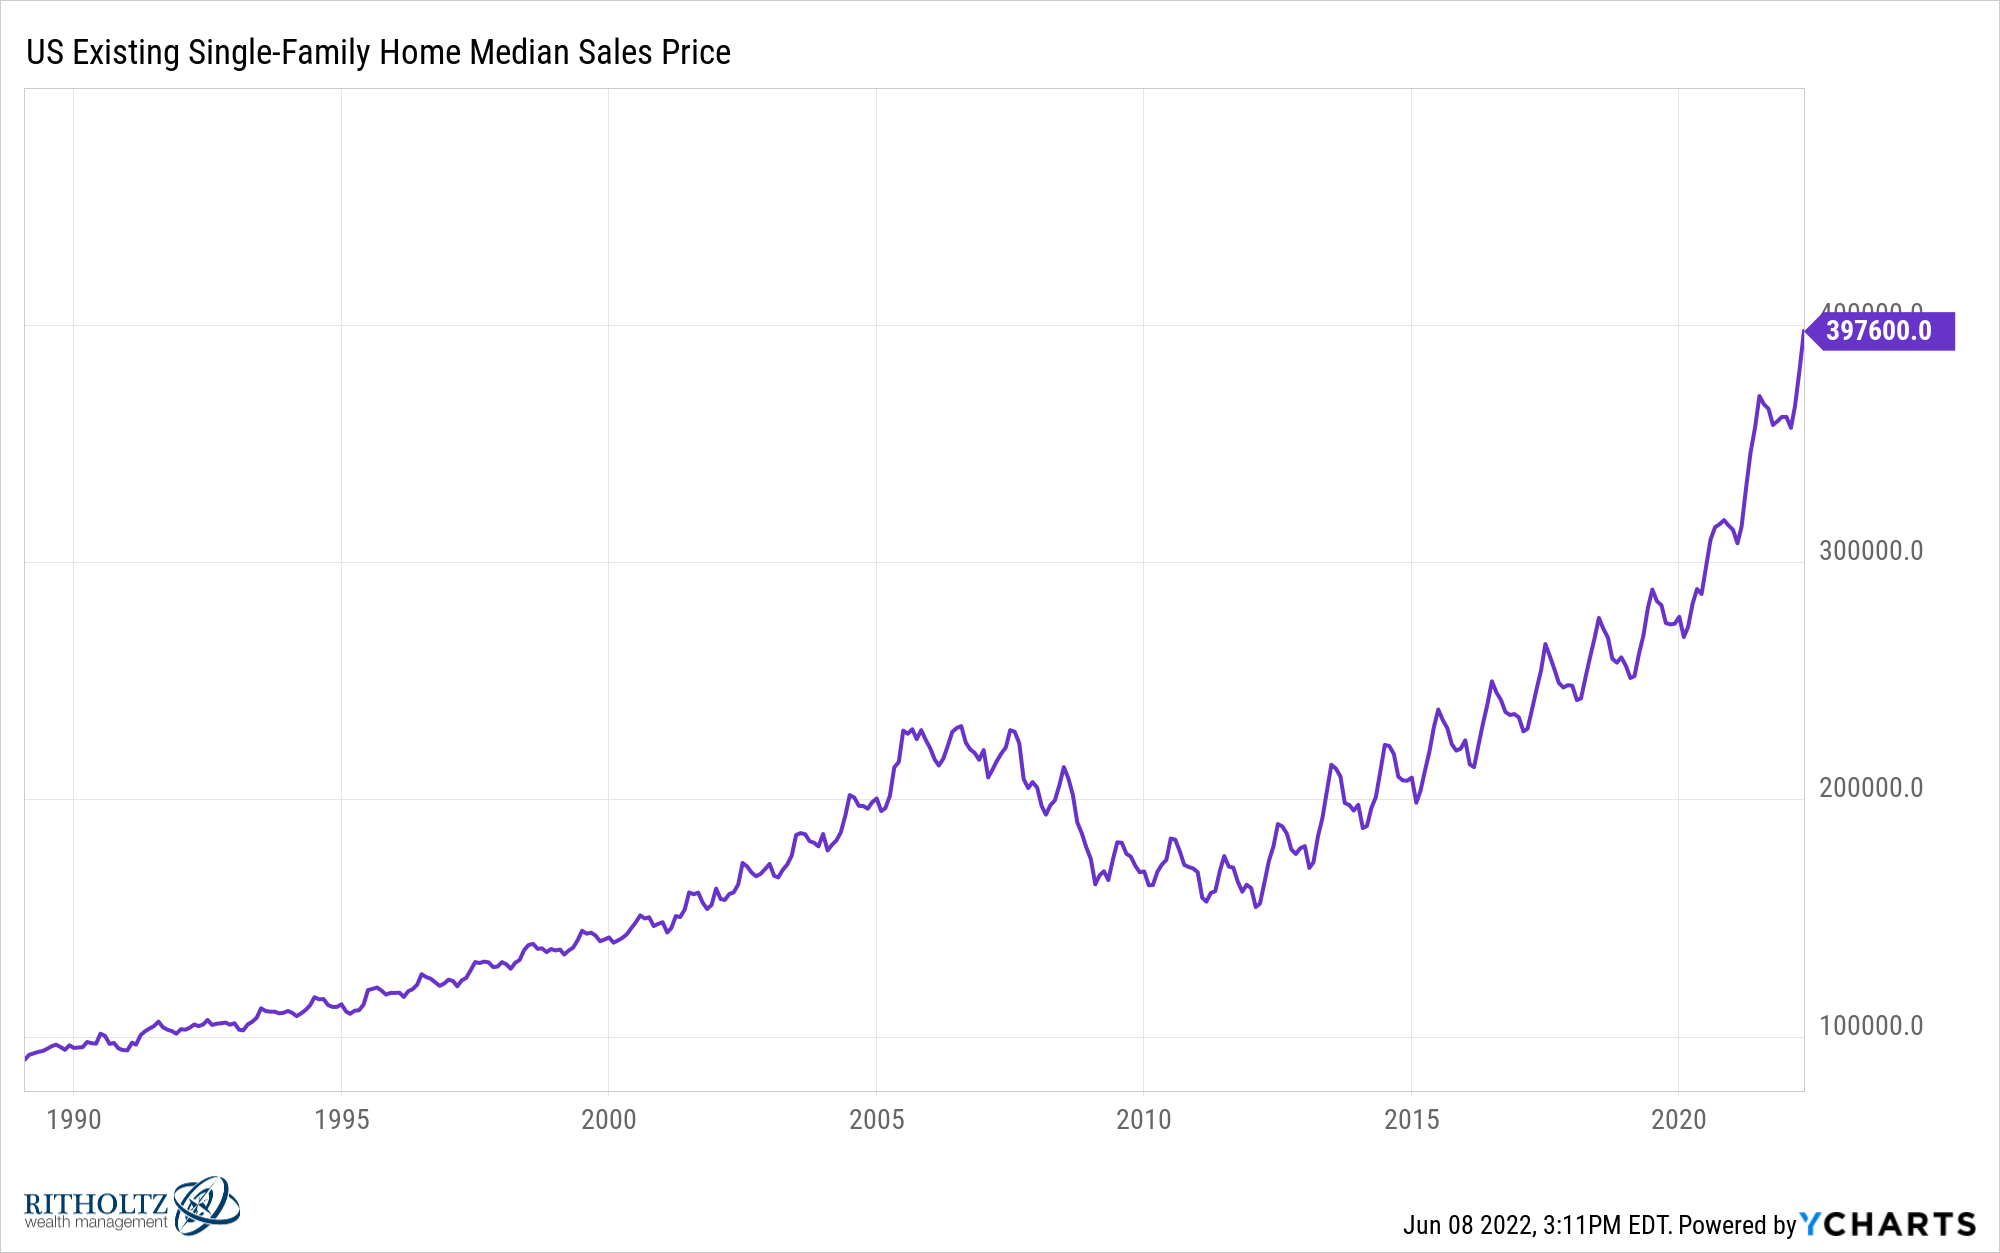
I would be shocked if we don’t see some of the hottest markets fall in the months ahead (places like Boise and Austin). Will prices fall nationally? It’s possible but even a cooling off period where prices stop rising would be a welcome development.
Even though inventories are rising, the supply of homes for sale remains just off record lows:
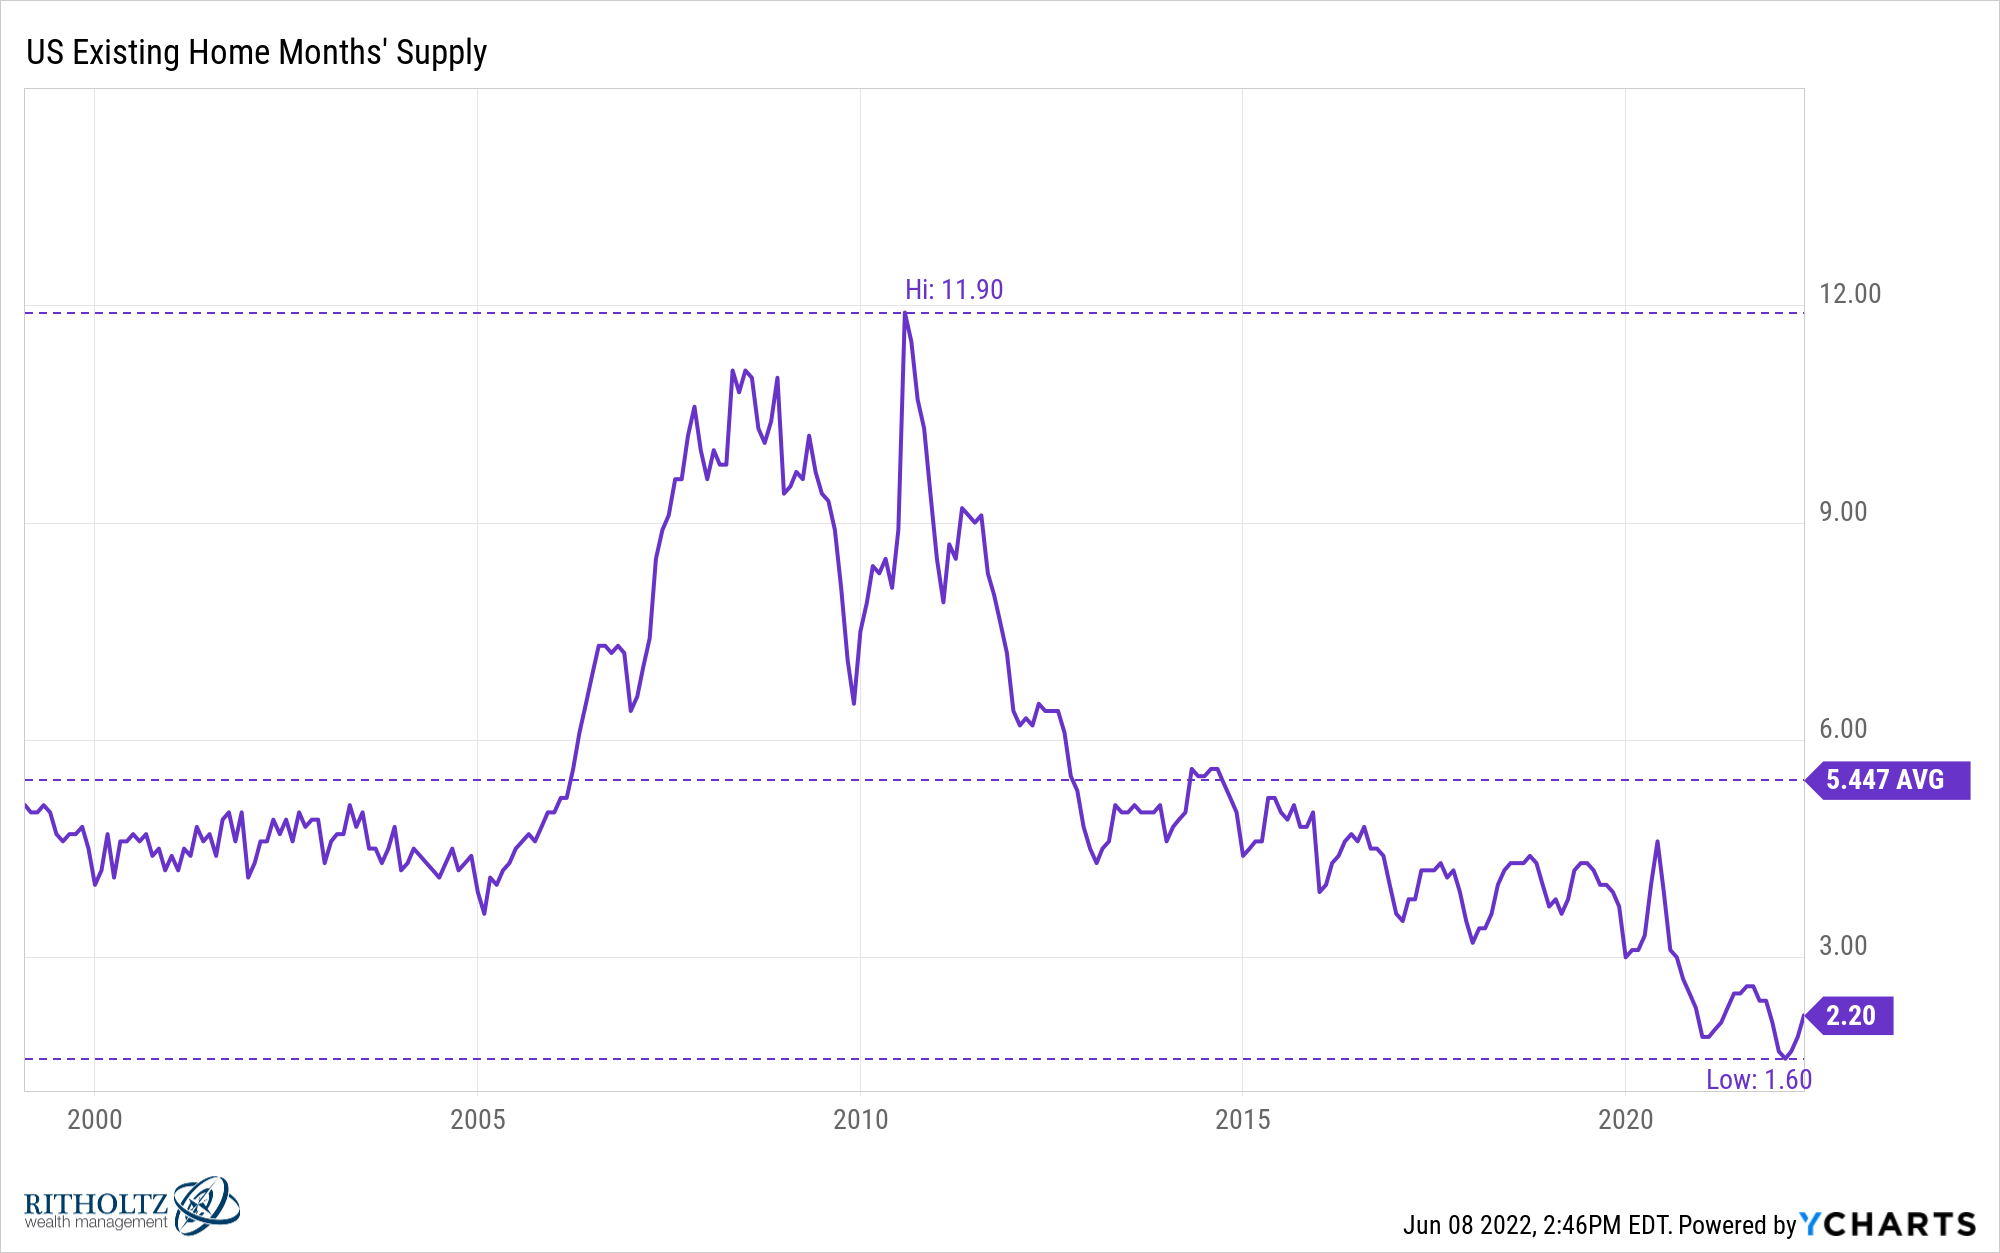
And the inventory situation still has a long way to go to get back to normal:
Motashami shared some thoughts on these numbers in a recent piece:
My next stage of watching inventory is getting back into a range of 1.52 – 1.93 million and monthly supply above four months with duration. Once we get to those levels, we will revisit the housing inventory situation. Then I can remove my savagely unhealthy housing market label because I believe that is an acceptable level. To have any meaningful price declines — to have my model get back in line — I need to see these things occur, and I believe higher rates can help bring some sanity back to the housing market.
The good news is things are improving and more houses are on the market. The bad news is the current levels are still well below historical averages and need to come up some more.
Most markets rarely exist in a state of equilibrium or normalcy but here are some qualitative goalposts for what I consider to be a more normal housing market:
- Potential buyers aren’t outbid at every turn by people with all-cash offers over the asking price.
- Houses aren’t selling sight-unseen with zero contingencies for things like inspections.
- Houses for sale might sit on the market for a few weeks, or *gasp* a few months while buyers consider their options and sellers consider their offering price.
- Buyers and sellers come to an agreement that might require a little give and take from both parties.
- People don’t feel like it’s impossible to find a home.
And if prices do have to come down a little no one should shed a tear for homeowners. Home equity has increased by $7 trillion since the start of the pandemic.
Homeowners have an equity cushion to soften the blow of a slowing housing market.
Michael and I talked about the housing market and much more on this week’s Animal Spirits:
Subscribe to The Compound so you never miss an episode.
Further Reading:
Why It Could be Years Until We See a Normal Housing Market
Now here’s what I’ve been reading lately:
- Do we need a recession? (Kyla’s Newsletter)
- Live by the sword (Reformed Broker)
- Don’t panic on sequence of returns (Morningstar)
- Optimism (Not Boring)
- Martin Scorsese on Ray Liotta in Goodfellas (The Guardian)
- The twin engine plan (Mental Cents)
1Atrocious is worse than horrendous right?

