On this week’s Portfolio Rescue we were asked a question about investing a decent chunk of your health savings account (HSA) money in the healthcare sector as a hedge against the rising cost of healthcare in the future.
On the surface, this idea makes sense.
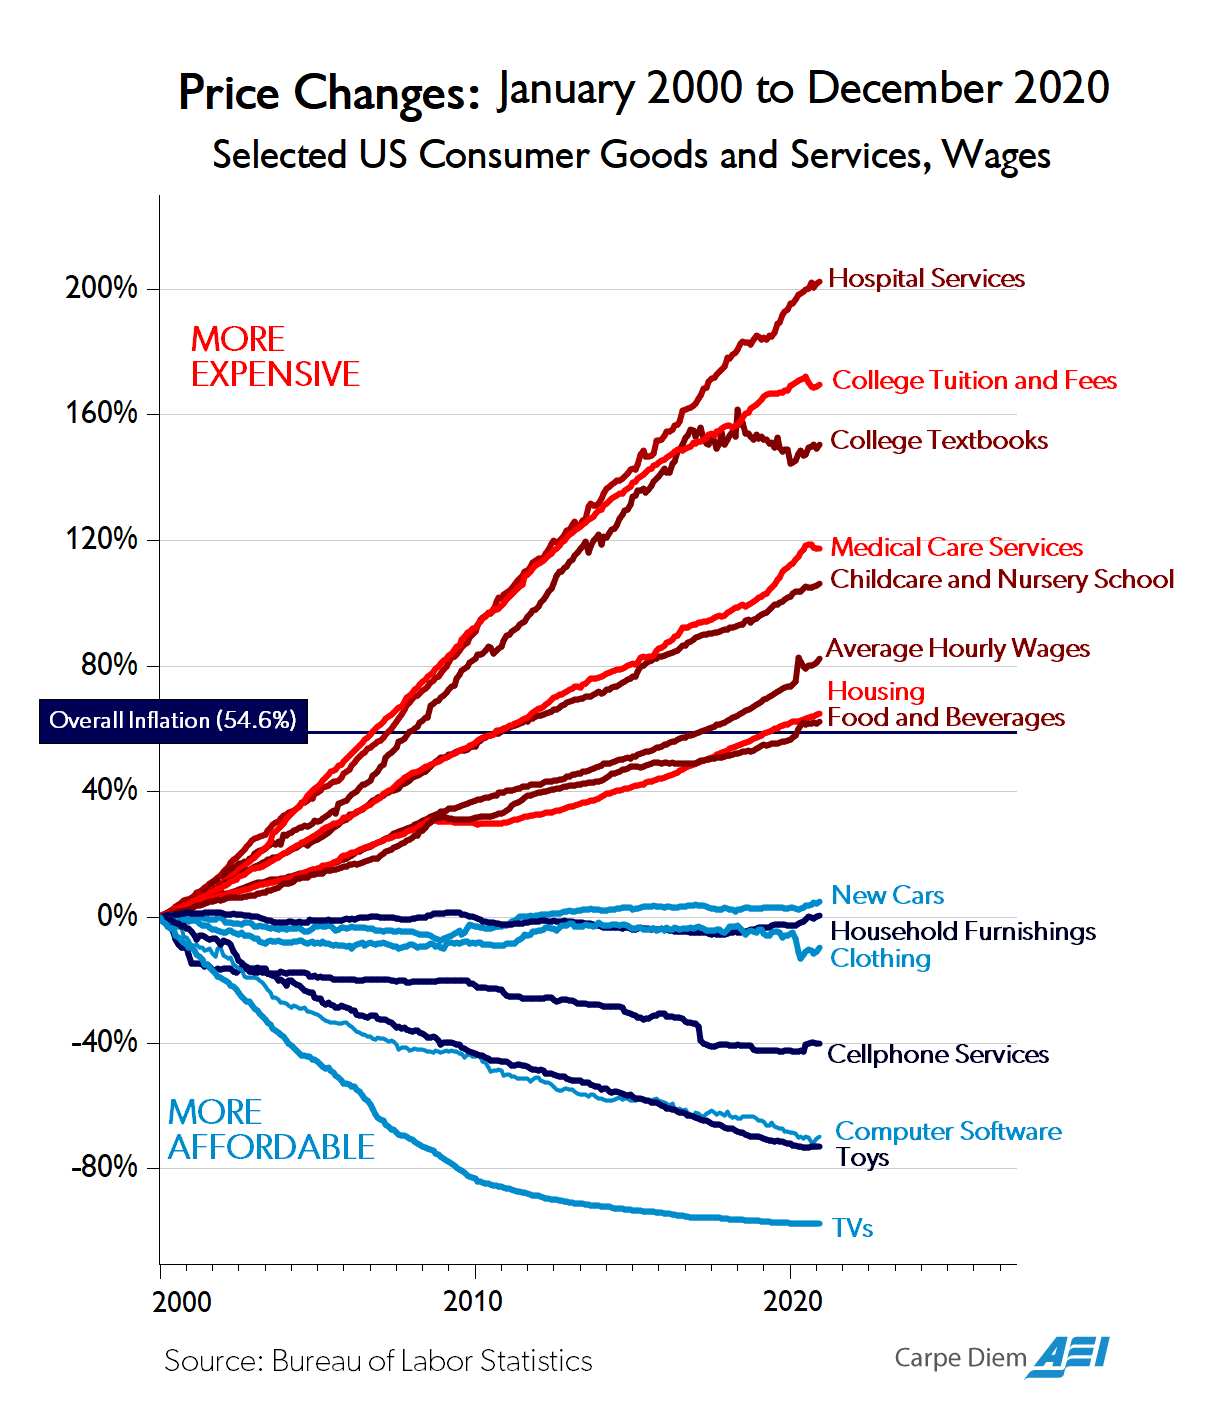
We’ve never had a generation as big as the baby boomers live as long as they are going to. You would assume the 70+ million baby boomers will eventually put a strain on the health care system, where prices are already rising faster than most categories over the long-run:
I understand the thinking here but would be remiss if I didn’t mention some of the risks involved.
Here’s a look at S&P 500 sector returns going back to 2009 ranked from best to worst each year:
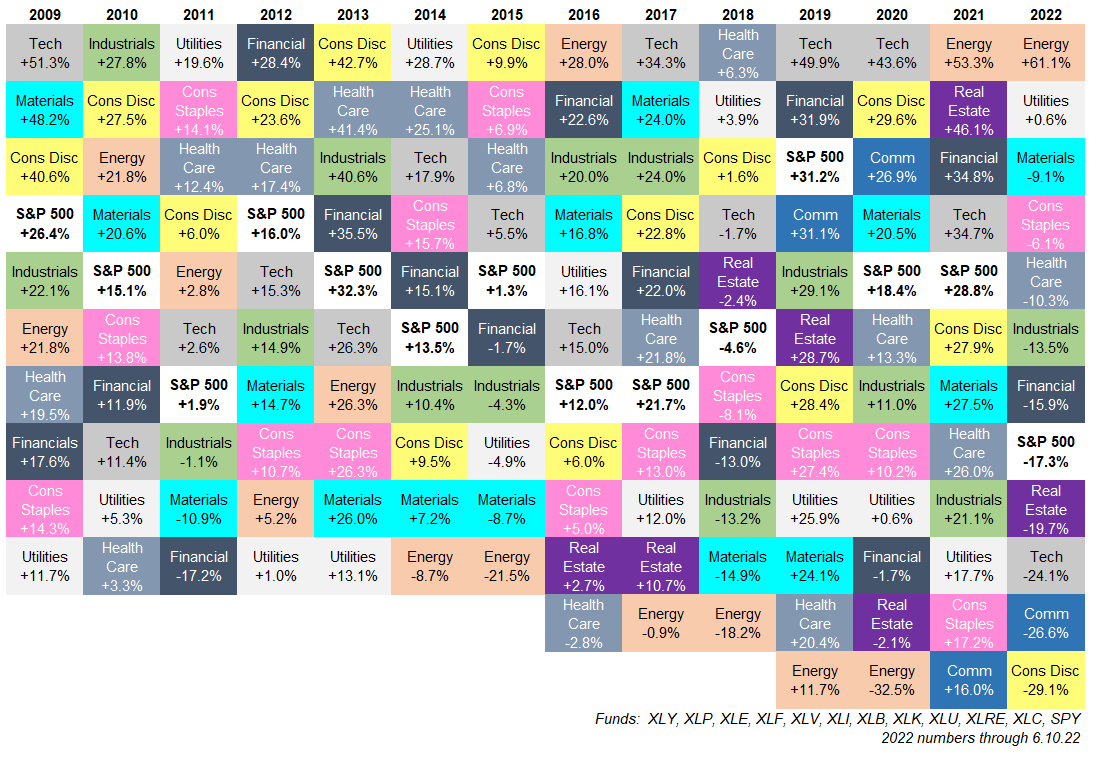
(I blame Standard & Poors for ruining the symmetry in my sector performance quilt by adding the real estate and communications sectors in recent years.)
Much like the asset allocation quilt, the biggest thing that jumps out from these numbers is how random the returns are from year to year.
Picking the best and worst-performing sectors in a given year is no easy task.
For example, let’s take the best and worst-performing sectors each year and calculate the difference in performance from high to low.
The average range between the top and bottom sectors since 2009 is 40%, meaning the best outperforms the worst by an average of 40% in a given year.
You can really get a sense of the extremes by looking at the year-to-date sector returns for 2022.
The best performer this year is the energy, which is up more than 60%. The worst performer is consumer discretionary stocks, down more than 29%.
That’s a spread of 90%!
Pick right and you can outperform the market by a wide margin. But pick wrong and you can underperform by an uncomfortable amount.
While energy stocks have crushed it over the past two years, they got crushed from 2014 to 2020. Energy was the worst-performing sector in 6 out of 7 years.
In this 7 year period, energy stocks were down 44% while the S&P 500 gained more than 130% in total.
Or how about financial stocks? From 2006 through 2016 the financial sector was down 4% in total while the S&P 500 rose nearly 100%.
Of course, you could also luck out by choosing the best performing sector.
In that same 2014 to 2020 period when energy stocks were down 44%, the tech sector was up more than 300%.1
Concentration leads to wider outcomes, both to the upside and the downside.
One of the biggest reasons you can see such a divergence in sector performance is because they’re far more concentrated than the overall market.
Here’s a look at the number of holdings for each sector ETF:
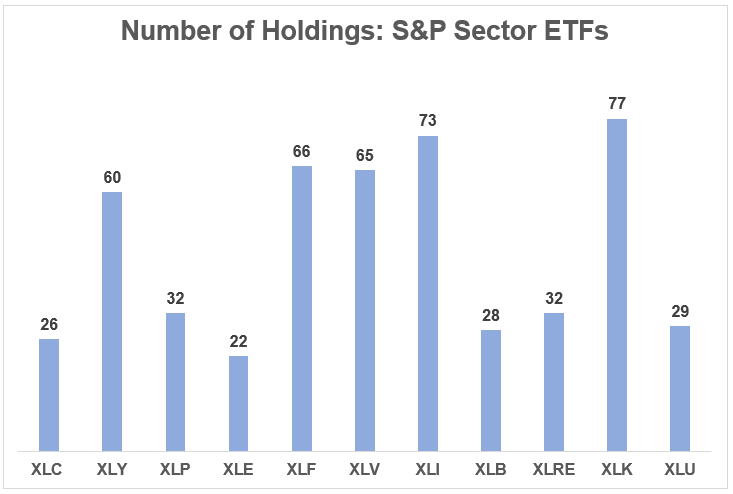
Almost half of these sectors have 32 holdings or fewer.
Interestingly enough, the concentration in S&P 500 sectors is similar to the profile of other developed stock markets outside of the United States.
This is the number of holdings in some of the biggest foreign developed stock markets:
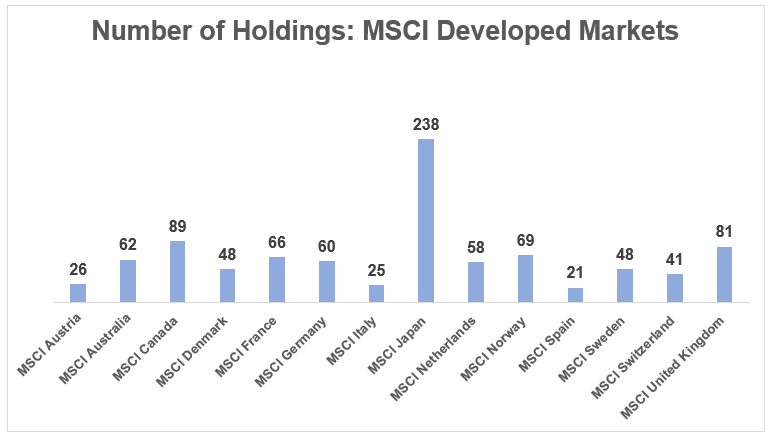
The MSCI Japan Index is the only one with more than 90 stocks.
The U.S. stock market makes up roughly 55% of the global stock market so it makes sense many of the sectors would be similar in terms of size and concentration to many of the other markets around the globe.
Unsurprisingly, the quilt of country stock market returns looks a lot like the sector performance chart:
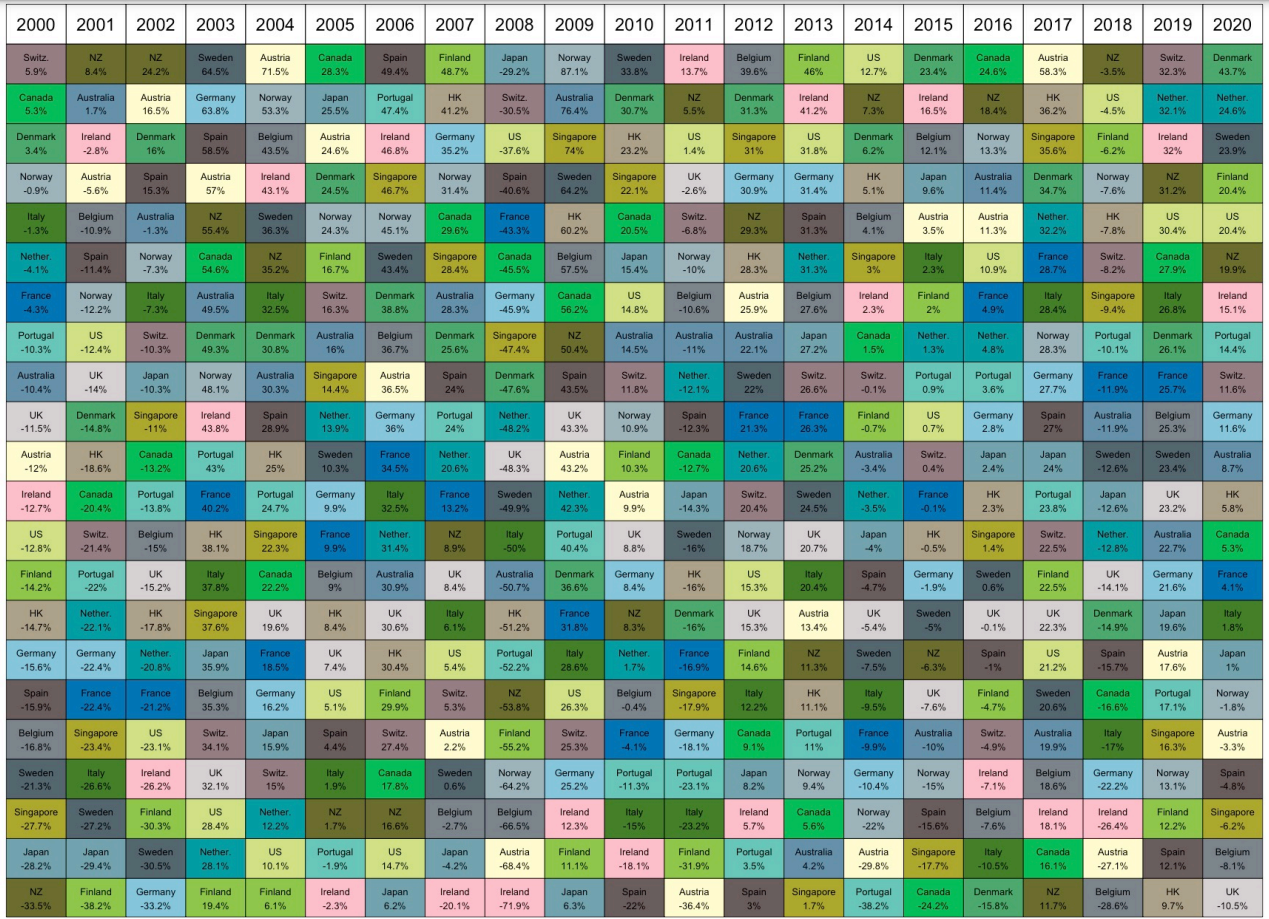
Picking the best sectors or countries is probably easier than picking the best stocks but not by much.
There are many benefits to investing in broad market index funds.
They’re low cost, low turnover, transparent, tax-efficient and low maintenance.
One of the best things about index investing is it frees you from the need to choose the best performing sector or country.
If you’re broadly diversified, you’re automatically going to be invested in both the best and worst performers but the best performers more than make up for the worst performers over the long run.
Further Reading:
Updating My Favorite Performance Chart For 2021
1And not from 2021-present, energy stocks have risen 147% versus a gain of 1.8% for tech stocks.

