I was updating some spreadsheets last week and looked yet again at the healthy run in U.S. stocks since 2009.
It’s been a remarkable run:
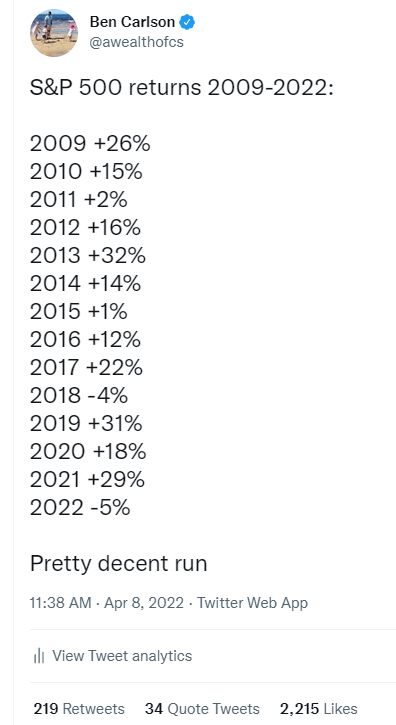
This tweet did some numbers (not to brag) so of course there was plenty of pushback since people who are online are fond of poking holes in historical market data.
There’s nothing wrong with some healthy debate. Everything is not always as it seems.
So I wanted to look at some of the biggest opposition people seem to have with these numbers:
What about earnings over this time? This is a fair question. It makes sense to wonder if fundamentals have risen with prices.
Here’s a look at the annual returns by year along with the annual earnings growth:
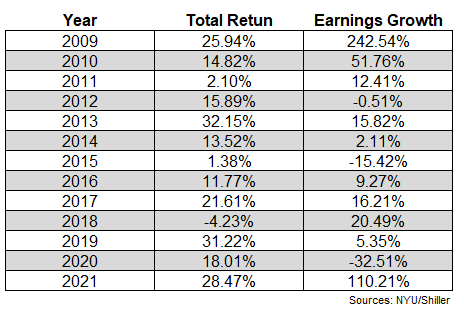
The S&P 500 was up 15.8% per year from 2009 to 2021. However, look at the earnings numbers — they were up 22.0% per year. Earnings have outperformed the stock market!
Now, these numbers also require some context.
Look at that massive spike in 2009 when earnings were up nearly 250%. That growth stems from the wipeout in corporate earnings in 2008 when they fell nearly 80%, mainly from banks that saw their businesses get decimated in the financial crisis.
OK, let’s throw that number out. Earnings still grew 12% per year from 2010 to 2021 versus gains of 15% per year from stocks in that time.
This bull market isn’t all built on the back of a massive sugar rush from investors going bonkers. Fundamentals have played a role too.
Yeah sure but compare these numbers to the Fed’s balance sheet. Its true monetary policy has been easier than beating the Detroit Lions for some time now.
Interest rates on the floor. Quantitative easing. Bond purchases. It would be disingenuous to suggest the Fed hasn’t had an impact on the stock market for the past decade or so.
But what about Japan?
Their central bank has maintained a similar monetary framework. Look at central bank assets as a percentage of GDP (via Yardeni Research):
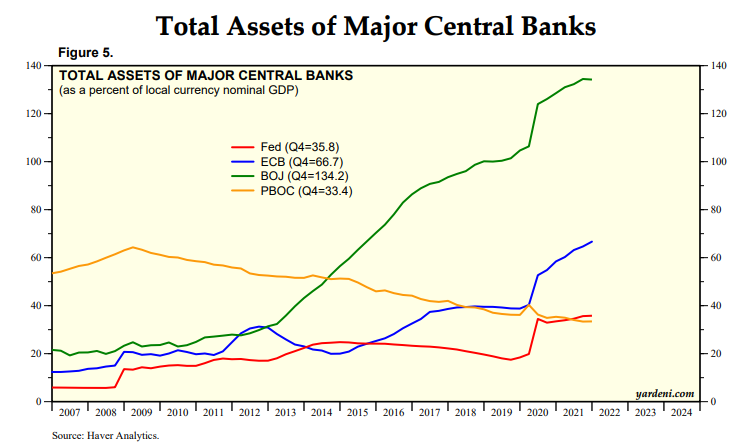
Central banks in both Japan and the European have turned on the printing press just like the U.S. yet those stock markets haven’t experienced nearly the same boom as we have.
Japan’s central banks even went so far as to begin purchasing stock ETFs for their balance sheet. Look at the returns since 2009:
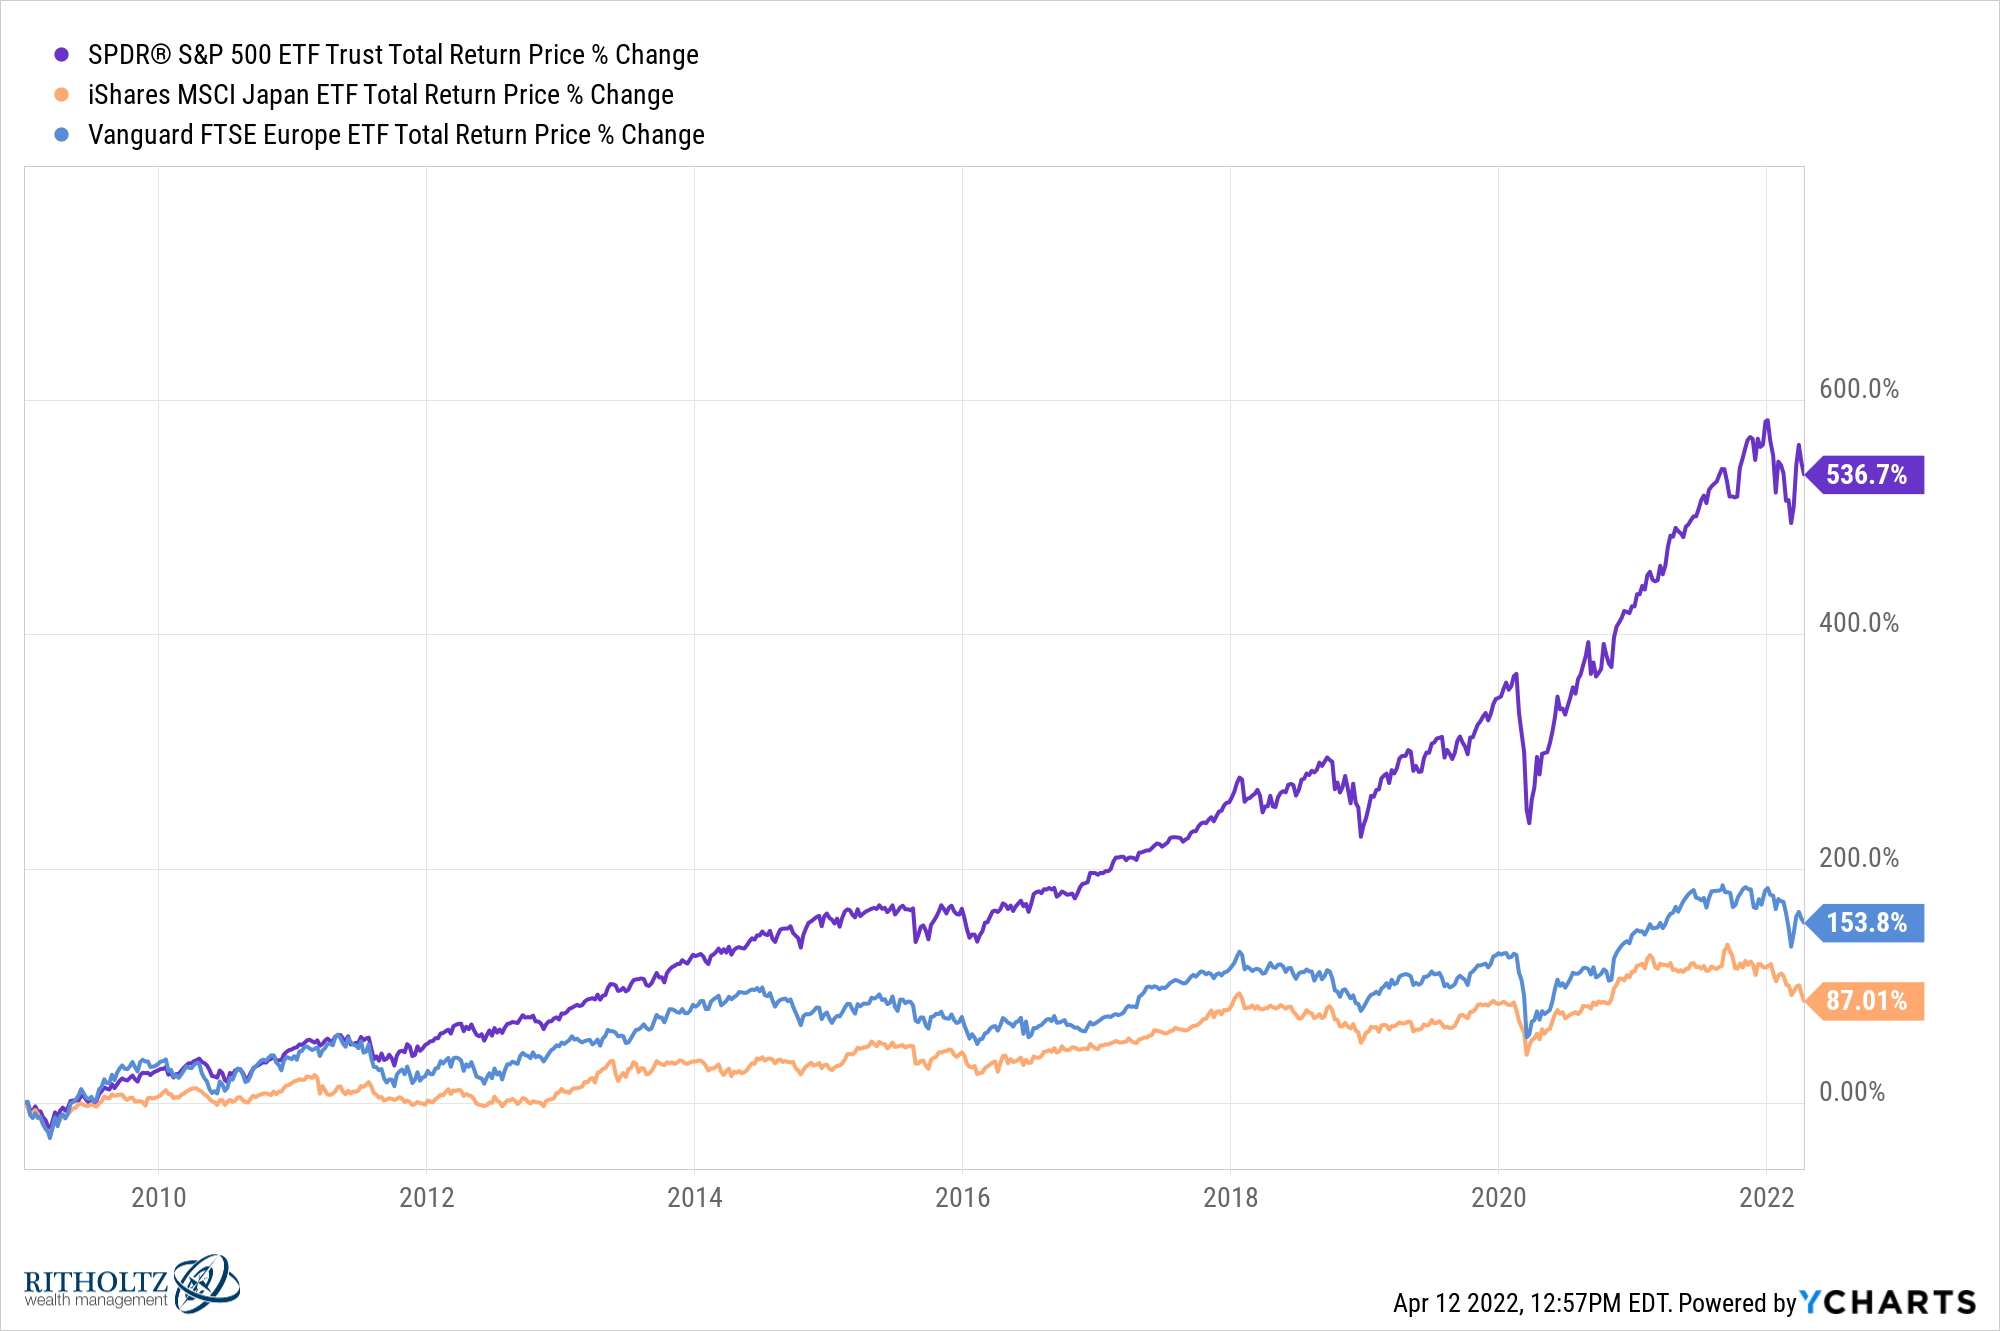
U.S. stocks are crushing these developed markets despite plenty of help from their central banks over the years.
Yes the Fed plays a huge role in the markets but monetary policy is not the be-all-end-all.
Sure, but what if you started this comparison in 2008? Yes, 2008 was in fact one of the worst years on record for the U.S. stock market. The S&P 500 fell roughly 37% that year.
The total return starting in 2009 is almost 540% or more than 15% per year.
The total return starting in 2008 drops to more than 300% or 10.3% per year.
Those returns are still good just not as eye-popping.
As always change your start or end dates and you can tell just about any story you want when it comes to historical market data.
Things don’t look nearly as good if you go back to 2000. Speaking of changing the start dates…it’s also true the year 2000 wasn’t a great starting point for U.S. stocks.
You can see the list of annual returns was not as kind in the first decade of this century:
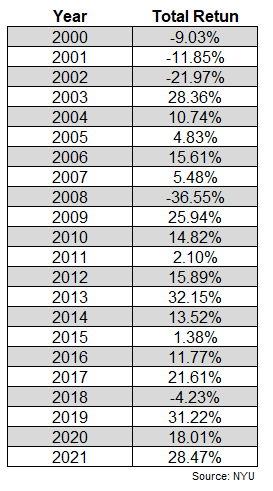
Three down years in a row to kick things off followed by the aforementioned 2008 debacle.
From 2000-2009 the total return for the S&P 500 was -9%. That’s right — annual returns of around -1% per year. Lost decades are not fun (unless you’re dollar-cost averaging).
So if you include that lost decade and use a starting date of 2000 now we’re looking at total returns of around 365% and 7.1% annual returns.
All things considered — duel 50% crashes bookending a lost decade along with a global pandemic — and you still get more than 7% per year is not terrible from possibly the worst entry point in history.
And if we go back to 1996 now we’re talking about annual returns of almost 11% per year.
We could do this all day.
In his excellent book How to Lie With Statistics, Darrell Huff writes:
The secret language of statistics, so appealing in a fact-minded culture, is employed to sensationalize, inflate, confuse, and oversimplify. Statistical methods and statistical terms are necessary in reporting the mass data of social and economic trends, business conditions, “opinion” polls, the census. But without writers who use the words with honesty and understanding and readers who know what they mean, the result can only be semantic nonsense.
Statistics requires nuance because different people can look at the exact same data point and come to polar opposite conclusions.
The thing to remember about market history is you can use it to tell just about any story you want — why things will be different in the future, why they’ll remain the same, how relationships change, rules of thumb, how to beat the market, etc.
Data is often in the eye of the beholder. The past can provide context and perspective but it can’t predict the future.
The good news is we need these differing opinions. That’s what makes a market.
Further Reading:
How to Win Any Argument About the Stock Market
