Since the inception of the Bloomberg Commodities Index in 1991, it’s up a total of 24%.
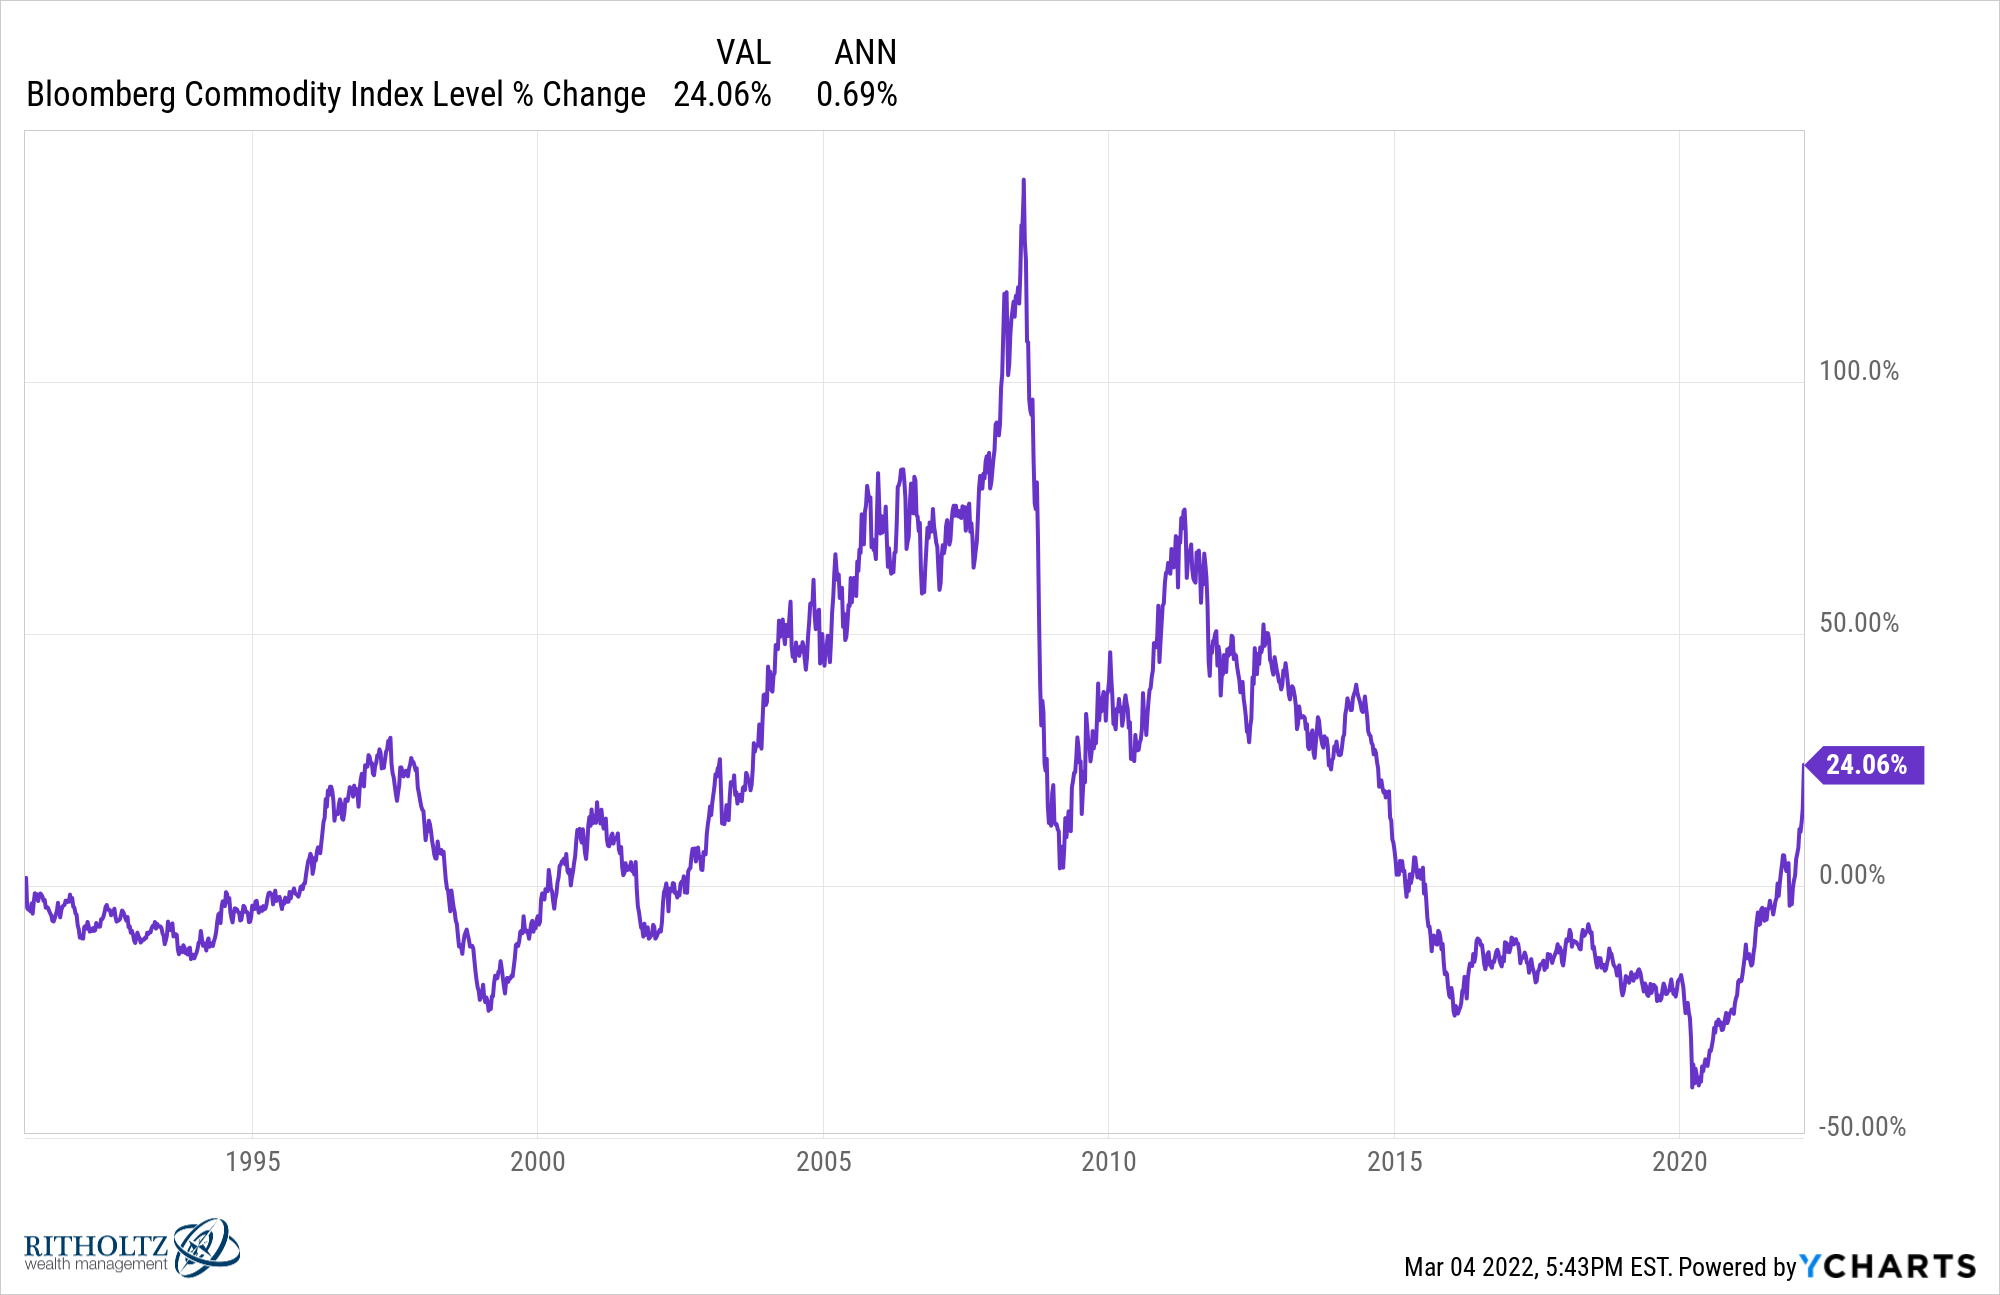
If you squint hard enough, you can see an annual return of just 0.7%.
That’s not only worse than the 2.5% inflation rate in that time; it’s a lower return than you would have earned parking your money in cash. Three month t-bills have returned 2.3% per year since 1991.
Even if we were to look at the fully collateralized version of this futures-based index1 the returns are still only 3% per year or so.
Commodities over the long-term give you roughly the returns of cash but with much higher volatility.
Volatility is not good or bad per se. It really depends on how you react to or use that volatility.
The volatility in commodities can present both danger and opportunity depending on where we are in the cycle.
You can see the boom-bust nature of this asset class:
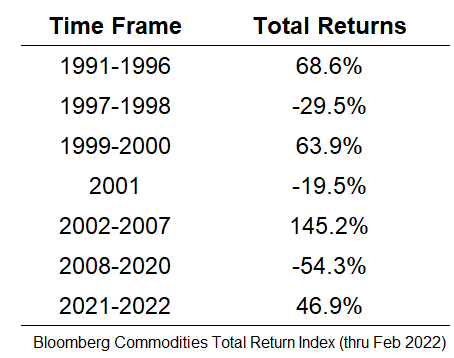
Sometimes these cycles are short. Other times they can last for an extended period.
Some people think we’re setting up for another commodities supercycle.
That’s certainly possible.
The transition to renewable forms of energy is sure to be a bumpy process. Plus we’re dealing with supply chain issues, the pandemic, more than a decade of underinvestment following the 2008 crisis and war with one of the biggest energy suppliers in the world.
Others assume technology is deflationary and bound to make prices cheaper over time despite the current headwinds.
This tug-of-war actually makes for interesting boom-bust cycles in technology and energy stocks as well.
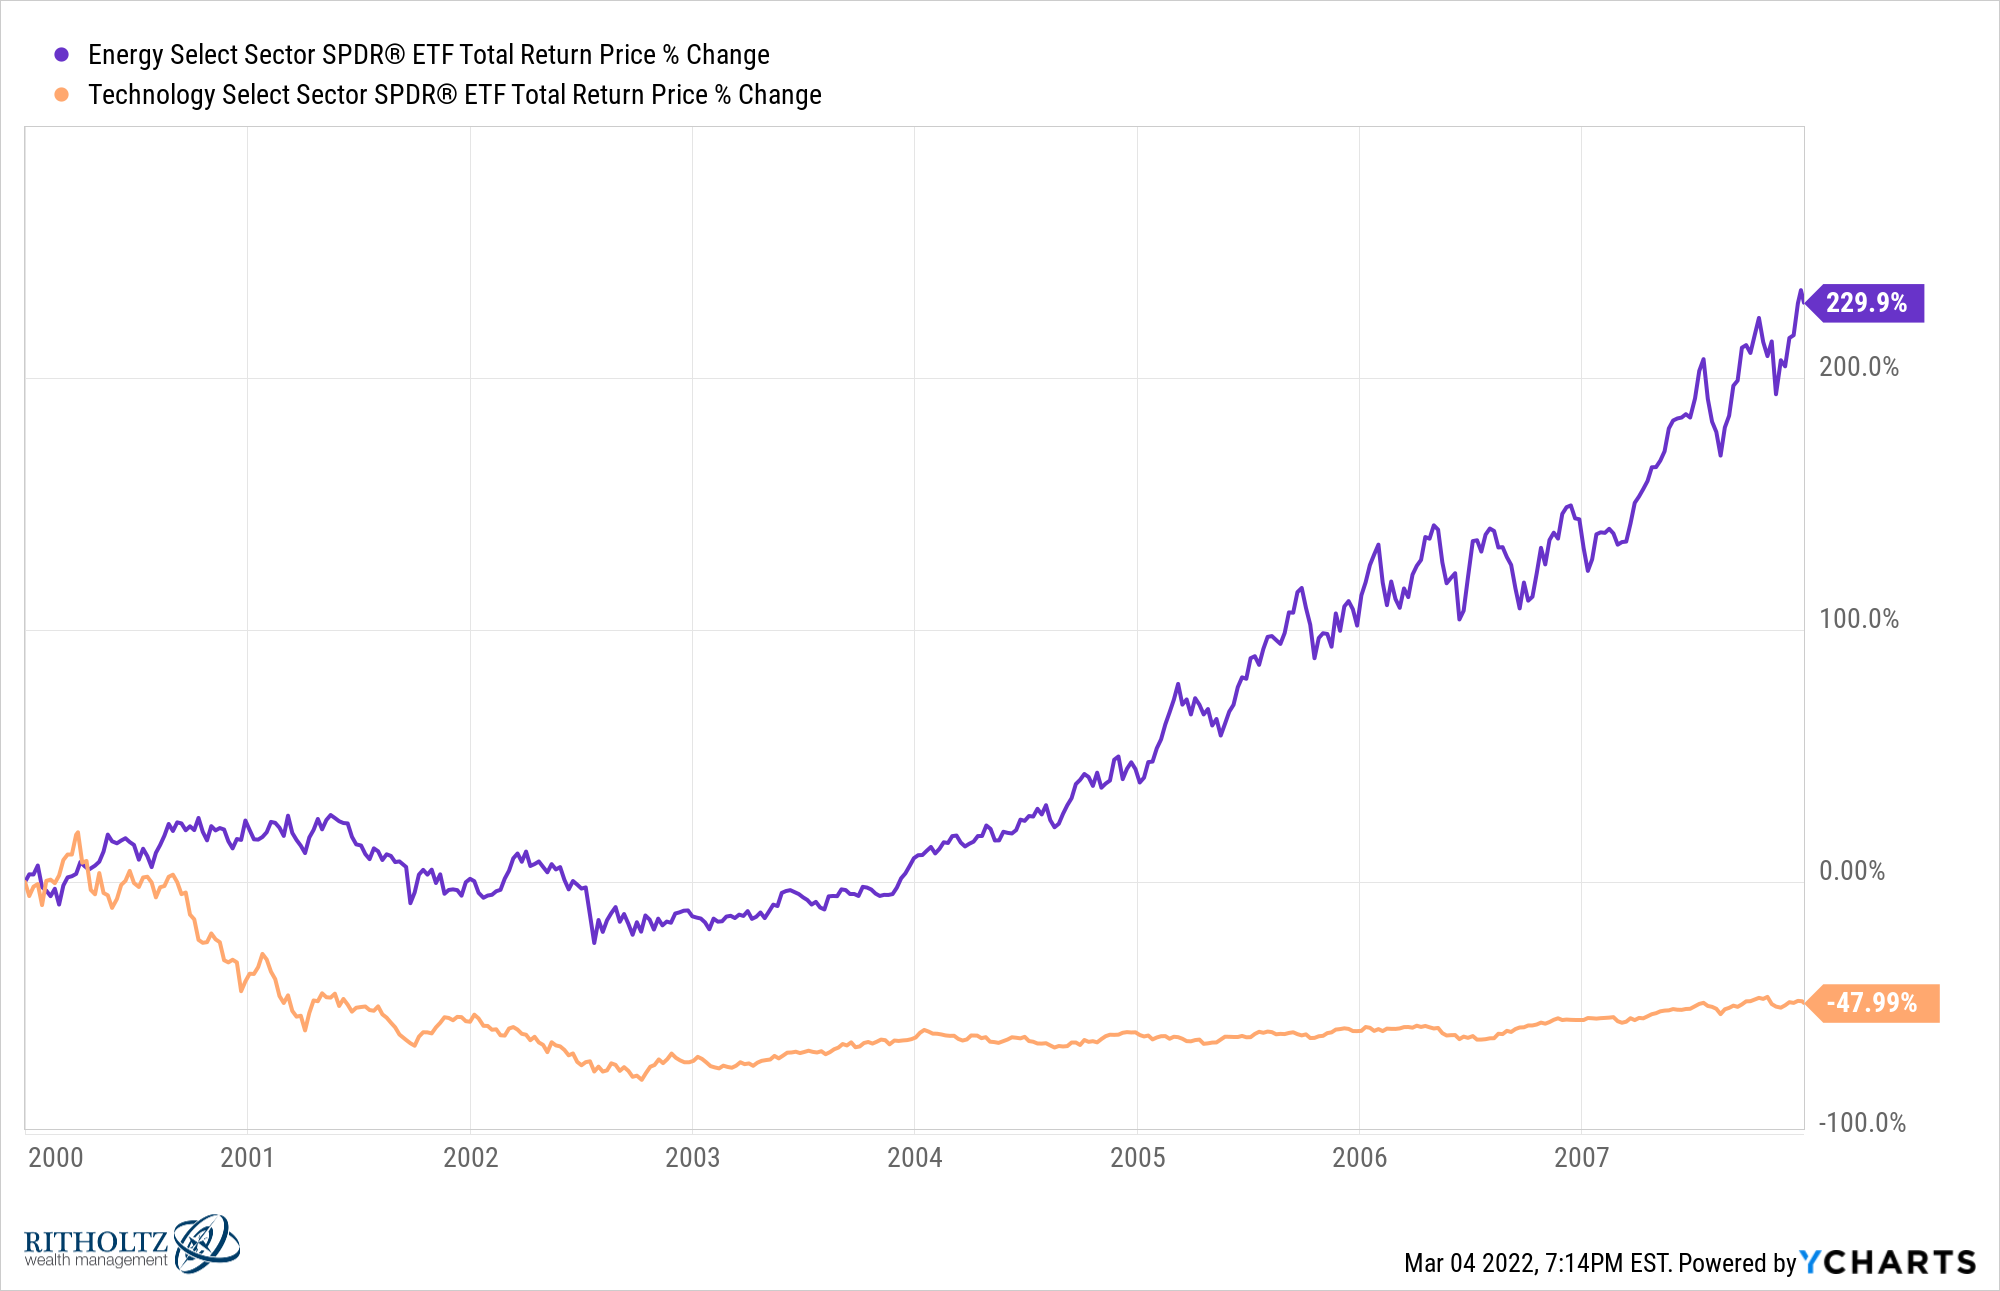
Following the bursting of the dot-com bubble, commodities went into a bull market that saw energy stocks smoke tech stocks:
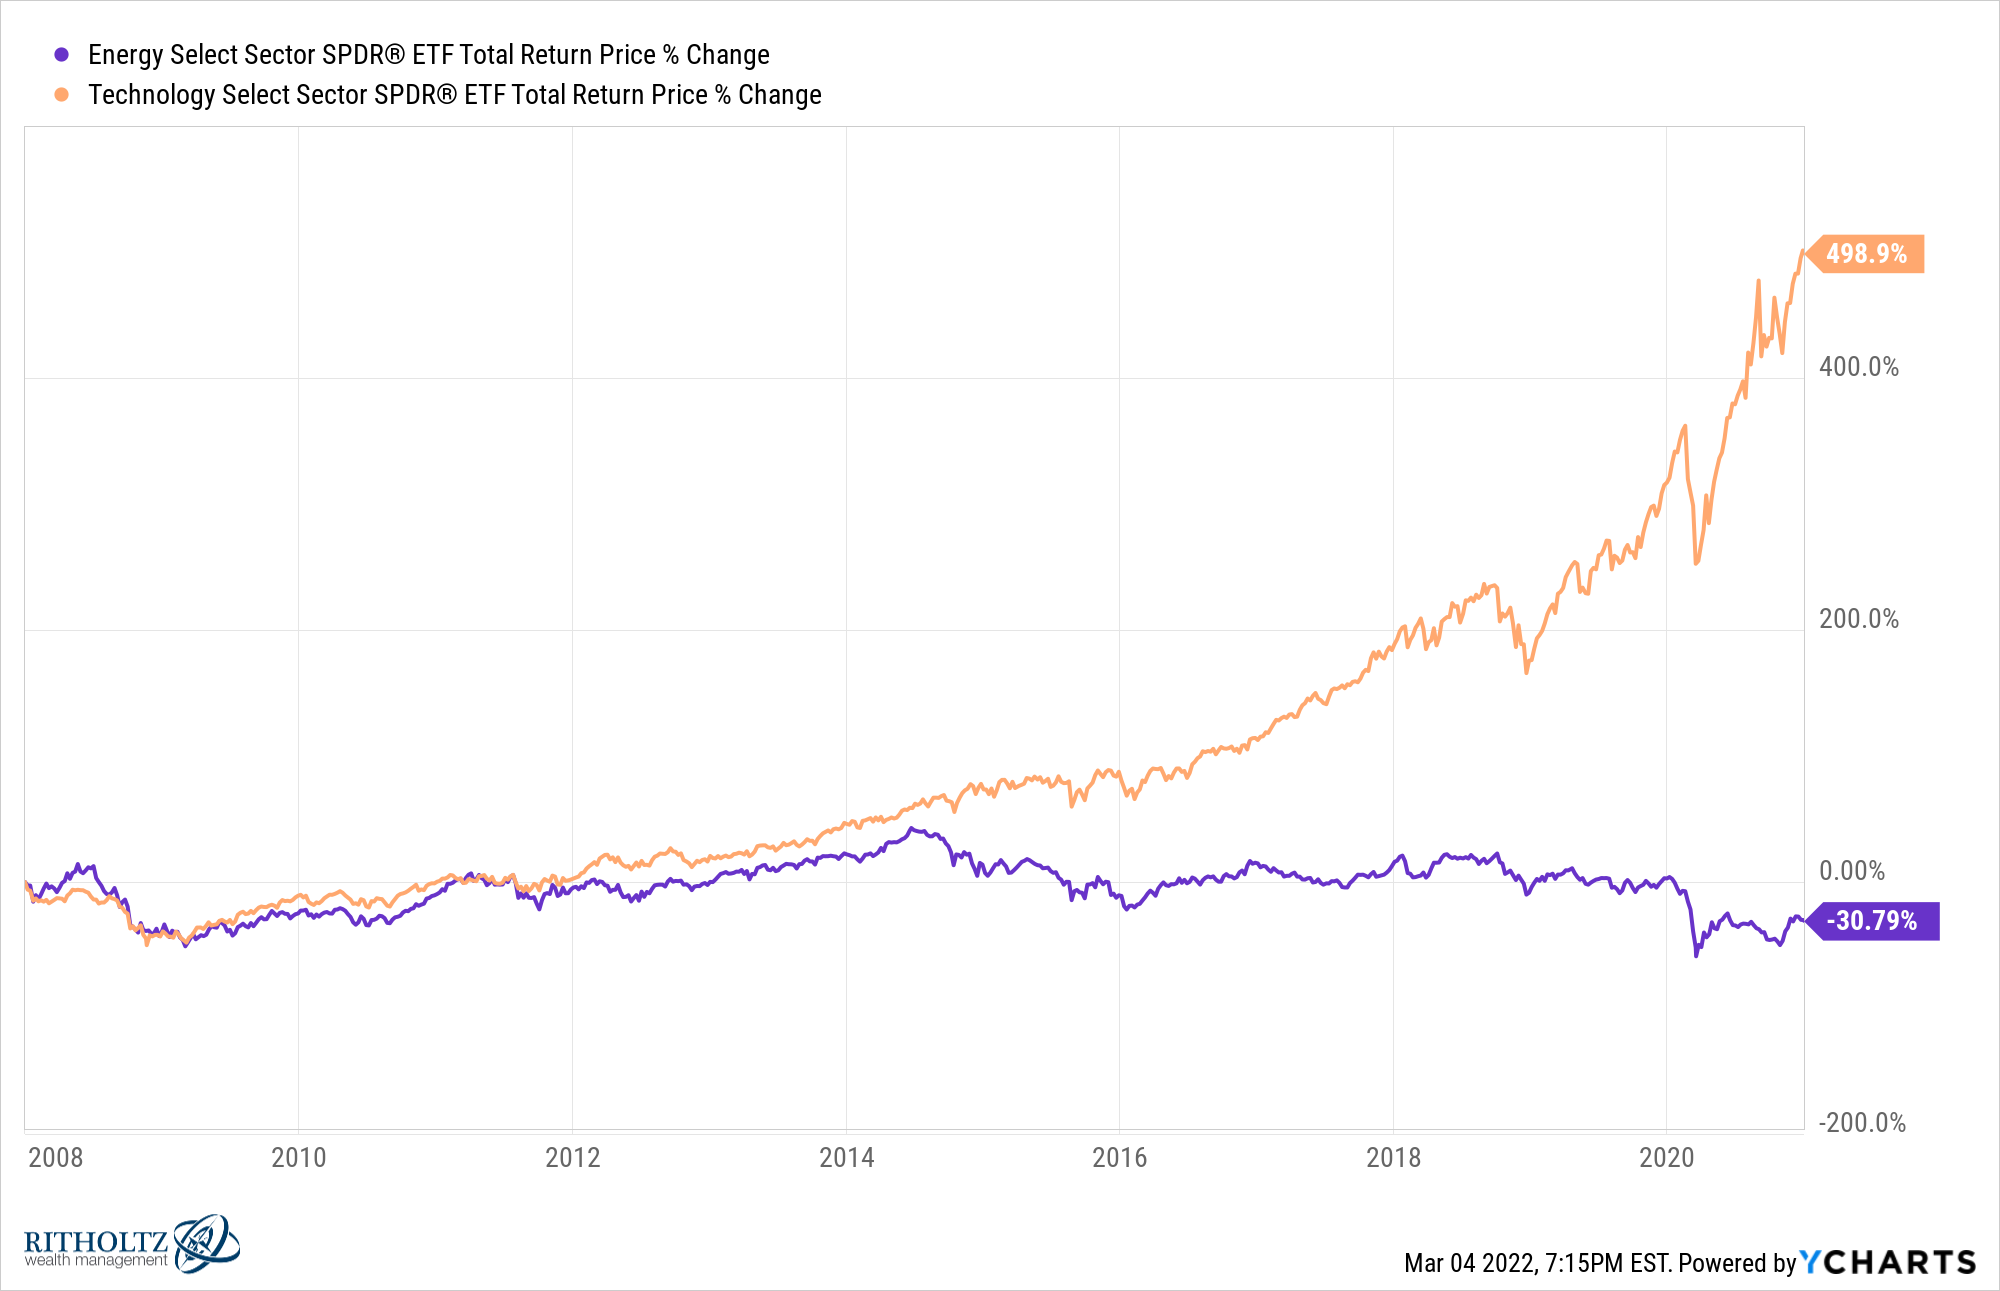
The aftermath of the Great Financial Crisis saw a reversal of this trend in a big way as tech stocks have crushed it while energy stocks got crushed:
The highest inflation rates in four decades and strong comeback in oil prices has seen energy stocks take the lead again since the start of 2021:
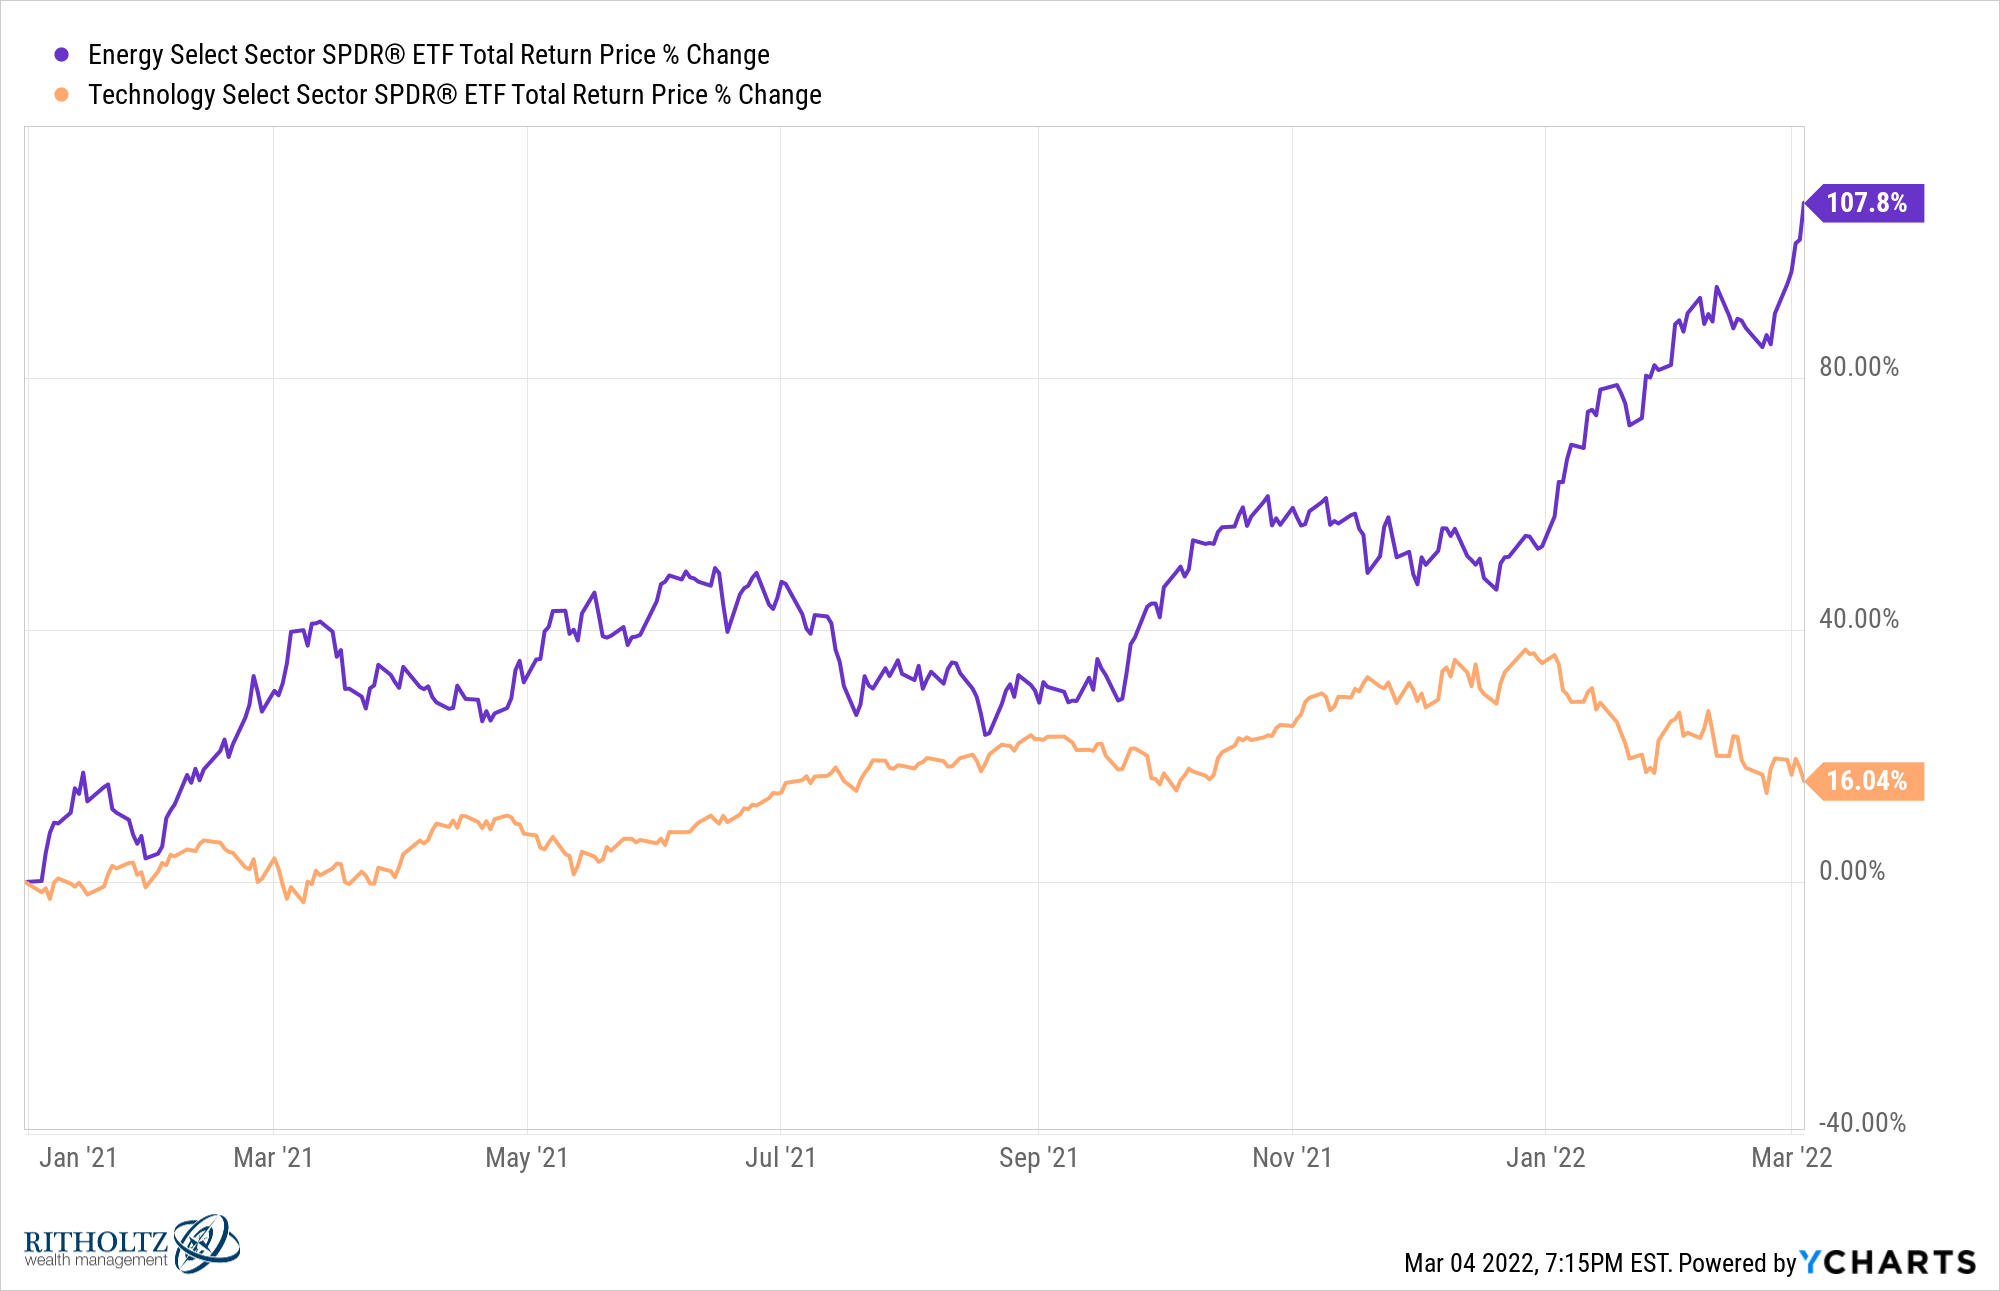
This year alone the energy sector is up almost 36% while tech stocks have fallen nearly 14%.
Despite the current run-up in prices, the long bear market in energy stocks caused some major damage to the sector.
In mid-2008, energy stocks made up 17% of the S&P 500. By the spring of 2020, it was down to 2.7% of the index. Even after gaining more than 100% since 2021, energy stocks still make up less than 4% of the S&P.
If you’re bullish energy stocks you could say they still have a lot of room to run after getting killed for more than a decade.
If you’re bearish energy stocks you could point to the fact that this stuff is always cyclical and nothing lasts forever.
Just like commodities, I don’t know if the energy sector outperformance will last. The hard part about cycles is their length and magnitude are impossible to predict.
The problem for many long-term investors is how they react to the boom-bust nature of commodities.
After the boom of the early-to-mid aughts investors rushed to add a commodities sleeve to their allocation.
Many did so just before commodities were about to go into hibernation starting in 2008.
After years of pain, volatility and losses, many investors who added commodities to their portfolios at the tail-end of the first decade of this century finally threw in the towel.
The worst thing you can do when it comes to cyclical investments is buy them after all of the boom-time gains have been made and sell them after eating the losses during a bust.
The resurgence in energy stocks and commodities combined with a slowdown in tech stocks also provides a nice reminder to investors that assumed tech dominance was here to stay — nothing lasts forever in the markets.
Everything is cyclical.
Further Reading:
Commodities Are For Trading, Not Investing
1The fully collateralized index assumes the futures contracts are being backed by cash which is then invested in 3-month t-bills. You could also quibble with this index as there are numerous ways to look at investing in commodities.

