A reader asks:
The S&P returned 18% in 2020 after a chaotic year, in 2021 volatility came way down and the S&P returned 28% – what psychological effects does this have on investors considering how much has gone on the past couple of years and US markets continue to outperform? With that in mind, have the recent sell-offs been totally valuation based or do you think there’s a behavioral dynamic at play as well?
There’s a litany of reasons the stock market is selling off right now (see here for my list).
Obviously, this week has been all about Russia going to war with Ukraine.
But there have been times historically when the stock market ignores geopolitical events, the Fed or economic data.
Then there are times when the markets worry mightily about these factors.
What’s the biggest difference? Why does the market care about this stuff sometimes but ignore it at other times?
If I had to narrow it down to one reason it’s probably price.
After huge gains, some investors are invariably going to find reasons to sell and lock in their gains. And after large losses, some investors are invariably going to find reasons to buy, even when the news continues to look grim.
During a bull market, everyone looks like a genius and it feels like the good times will last forever. Things do get better but eventually they get better at a slower rate.
Once higher expectations are built-in and performance has been good, it’s much easier for investors to sell. When things start to fall many investors want to lock in their profits.
Sometimes these corrections turn into bear markets.
During bear markets everyone looks like an idiot and it feels like the bad times will last forever. Things do get worse but eventually they get worse at a slower rate.
This is how markets bottom and turn higher.
Rinse and repeat.
These cycles don’t work on a set schedule but you get the idea.
Just look at the last three year’s worth of gains for the S&P 500:
- 2019 +31.5%
- 2020 +18.4%
- 2021 +28.7%
Now the Nasdaq 100:
- 2019 +39.0%
- 2020 +48.6%
- 2021 +27.4%
That’s a three year total return of 100% for the S&P 500 and more than 160% for the Nasdaq 100.
Returns have been phenomenal.
Growth stocks, specifically of the tech variety, have been getting crushed in recent months, with many names down 50-80% over the past year.
Why is this the case?
Sure, there’s the Fed and rising rates and higher inflation and inflated expectations from the pandemic. But this group also experienced outstanding returns for many years.
The Nasdaq 100 was up more than 1400% in total from 2009 through 2021. That’s an annual return of more than 23% for nearly a decade-and-a-half. The good times simply couldn’t last forever.
The 1987 Black Monday crash is a perfect example of this phenomenon.
There were a lot of structural forces that helped cause the worst one-day crash in history.
Interest rates were rising (at nearly 10% for the 10 year treasury bond) and portfolio insurance helped set off a cascade of sell orders that day.
But stocks had also experienced mammoth returns in the lead up to that crash.
Through August of that year the S&P 500 was up nearly 40% (and that’s without dividends) before the crash:
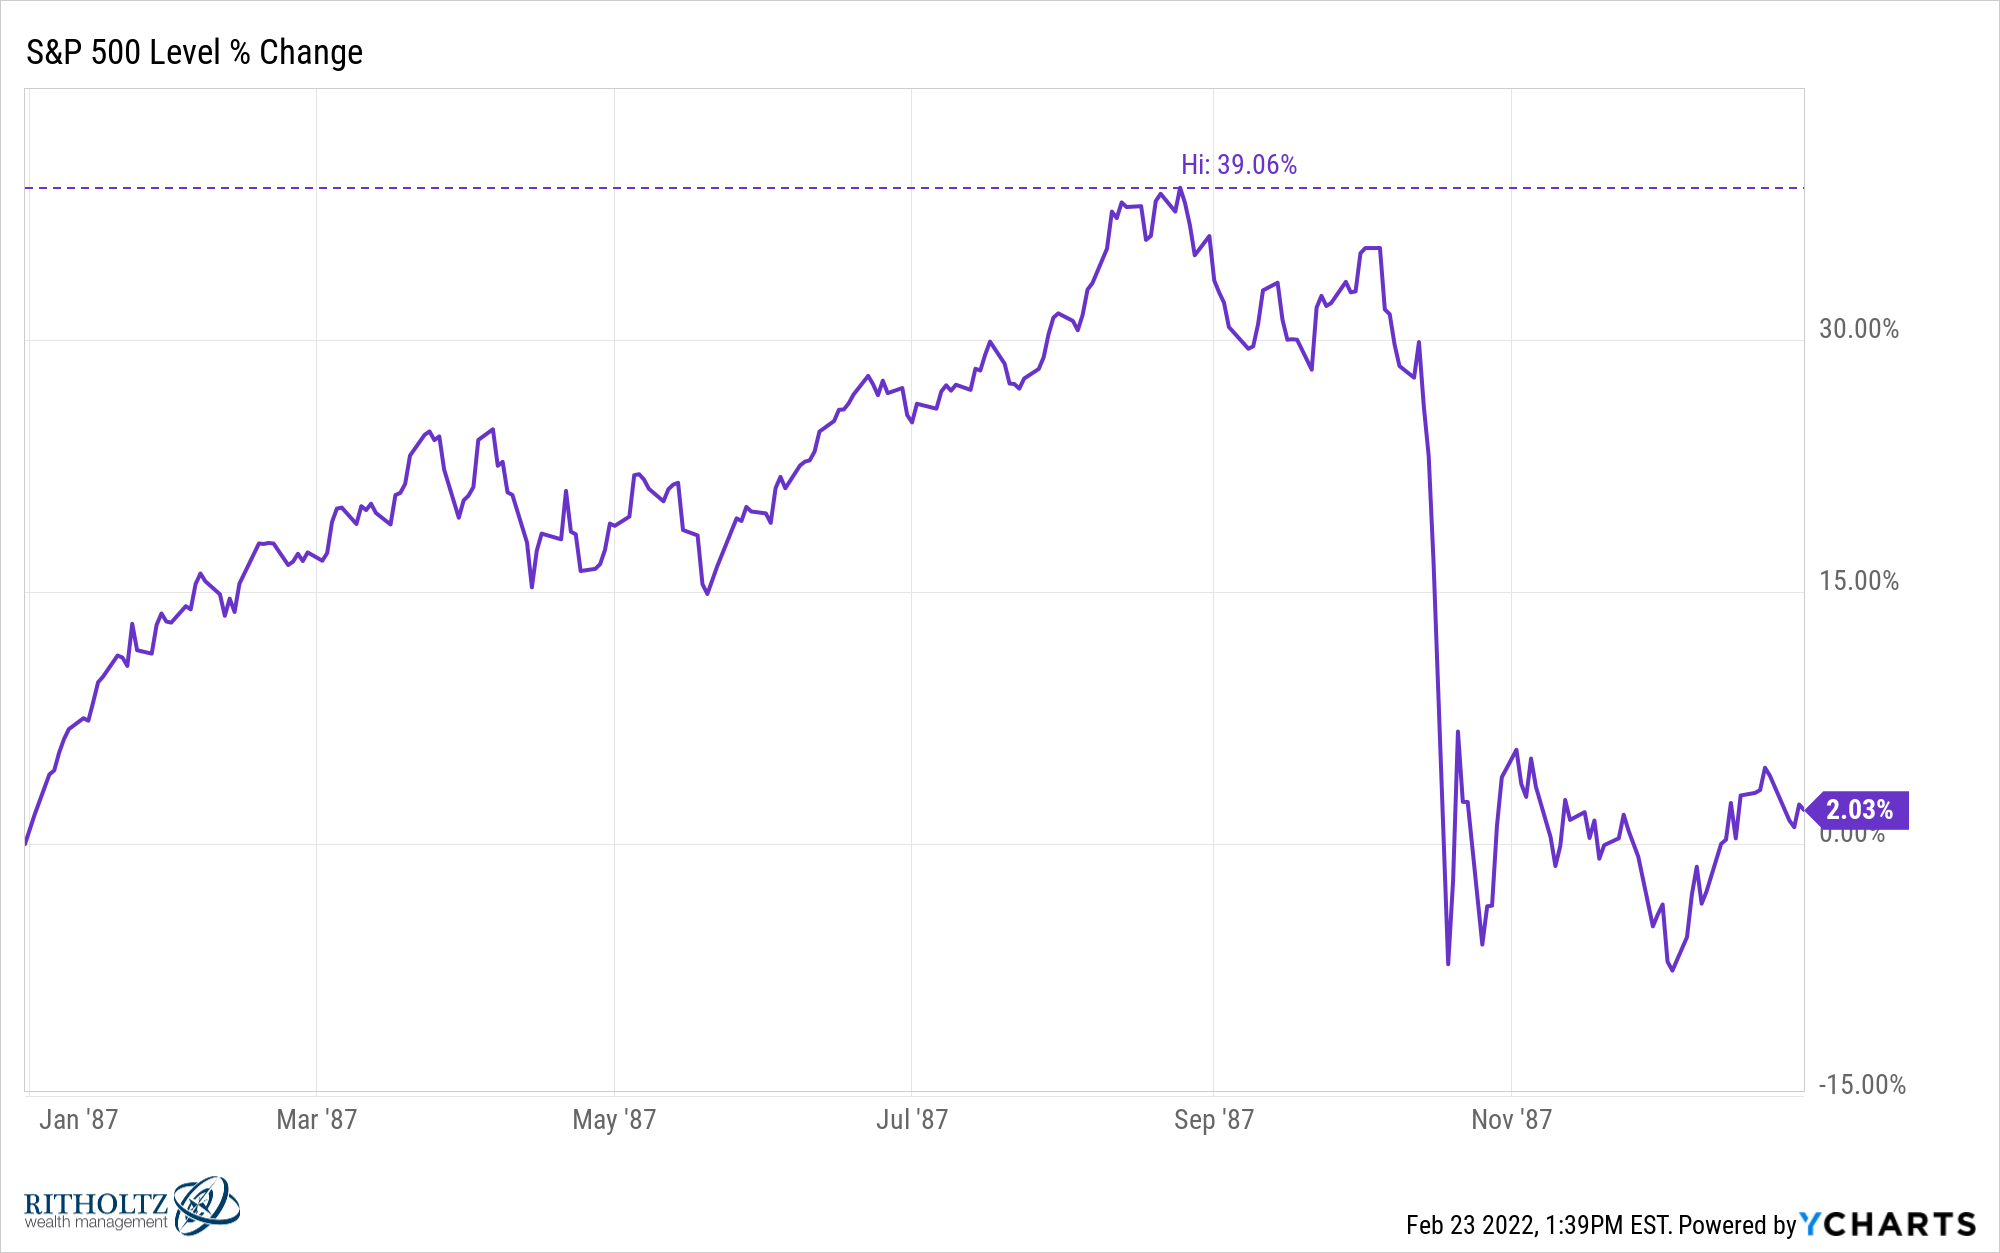
And that 40% return was following 20% annual returns from 1982-1986.
Sometimes the reason stocks fall is because gains were too good for too long and investor expectations get out of whack with reality.
You could blame higher valuations for this but investor psychology is all that matters in the short term.
I suppose this could turn into a full-fledged crash situation when you consider all of the moving pieces involved in the global economy right now.
But it’s also important to remember most of the time the stock market falls, a correction is far more likely than a crash.
By my calculations, this is the 37th correction of 10% or worse1 since 1950 for the S&P 500. This is what the distribution of those corrections looks like:
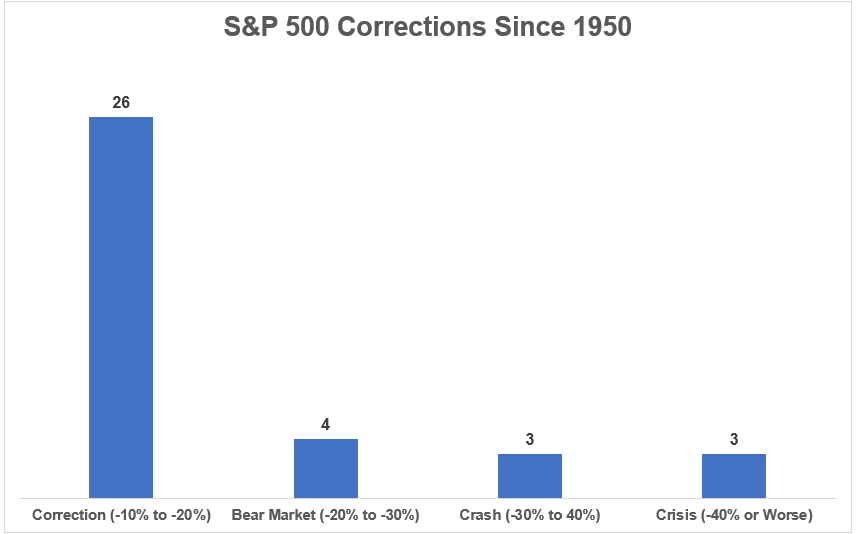
Roughly 3 out of every 4 double-digit drawdowns have been just a correction (by my definitions here). Bear markets, crashes and full-blown crises do happen but they’re rare.
Of course, that doesn’t mean this correction won’t turn into a crash. This is where investor psychology makes predicting this stuff extremely difficult.
Just as the stock market can overshoot to the upside, sometimes losses beget losses and the pendulum swings too far in the other direction.
It feels like the world is unraveling at the moment.
Someday it’s not going to feel like that anymore.
I just don’t know when.
We talked about this question on this week’s Portfolio Rescue:
Bill Sweet joined me as well to discuss questions about the tax treatment of crypto, tax retirement withdrawal strategies and the strangest tax write-offs people try.
Further Reading:
The 3 Ways to Win During a Market Correction
1As of this writing, the S&P 500 is down roughly 13% from all-time highs.

