History doesn’t repeat but it often rhymes.
I don’t know if it was Einstein, Twain, Munger or someone on Instagram who originally said this but it’s certainly something market people say all the time.
We humans are pattern-seeking creatures so it makes sense that we would continually look to the past to help us explain the present or future.
Assuming we understand exactly what’s going to happen based on what’s already occurred helps put our minds at ease, even if we all know predicting the future is impossible.
I do believe human nature is the one constant when it comes to understanding the markets over time but I also believe humans are unpredictable.
While the markets are always different now than they were in the past for the simple reason that our knowledge of the past compounds over time, you can’t ignore the fact that certain markets do feel eerily similar across time.
The current environment of a correction in the overall stock market while certain areas of the market are getting absolutely slaughtered has been gnawing at me for weeks like an actor in a movie I just can’t place.1
Why does this market feel so familiar to a time I’ve read about in the past?
And then it hit me.
Oh yeah, this is basically the end of the Go-Go Years of the 1960s!
Obviously, I was not alive during the Go-Go Years of the 1960s or its aftermath but I have read the best book about that period, The Go-Go Years, by the inimitable John Brooks.
The Go-Go Years was a period that was defined by growth stock outperformance, millions of new retail investors, tons of speculation and star portfolio managers who were raking in the money based on extraordinary performance numbers.
Sound familiar?
When things finally fell apart the overall stock market went into a nasty bear market, down 36%, but the hottest stocks were drilled more like 80%. Brooks explains:
From the September 1929 peak to the nadir of the Great Depression in the summer of 1932, the Dow industrial average dropped from 381 to 36, or just over 90 percent. From the December 1968 peak to the May 1970 bottom, the same index dropped from 985 to 631, or about 36 percent. By that standard, a pistol shot against a mortar barrage. But, as we have had occasion to note before, that standard really will not do; the Dow accurately reflected the 1929-1932 market when house painters and office girls were making their plunges in Dow stocks like General Motors and Standard Oil of New Jersey, and woefully failed to reflect the 1969-1970 market when similar plunges were far more likely to be made in Control Data or Ling-Temco-Vought.
A financial consultant named Max Shapiro, writing in the January 1971 issue of Dun’s Review, tried to construct a new yardstick more appropriate to the new situation. As a rough modern counterpart to what the Dow represented in the old days, Shapiro made a list of thirty leading glamour stocks of the nineteen sixties — ten leading conglomerates including Litton, Gulf and Western, and Ling-Temco-Vaught, ten computer stocks including IBM, Leasco, and Sperry Rand, and ten technology stocks including Polaroid, Xerox, and Fairchild Camera. The average 1969-1970 decline of the ten conglomerates, Shapiro found, had been 86 percent; of the computer stocks, 80 percent; of the technology stocks, 77 percent. The average decline of all thirty stocks in this handmade neo-Dow had been 81 percent. Even allowing for the fact that the advantage of hindsight gave Shapiro the opportunity to choose for inclusion in his list particular stocks that would help prove his point, his analysis strongly suggests that, as measured by the performance of the stocks in which the novice investor was most likely to make his first plunges, the 1969-1970 crash was fully comparable to that of 1929.
Brooks makes the case the 1968-1970 bear market actually had an even bigger impact on the investing public than the Great Depression. There were just 4-5 million people who even invested in stocks in the United States in 1929. By 1970, there were more than 30 million investors.
As far as historical market crashes go this one never gets mentioned with the likes of the Great Depression, 1973-1974 bear market, 1987 crash, dot-com bust or the 2008 crash.
It appears the reason for this is the performance of the overall market may have masked some of the pain in specific stocks and sectors where many investors had allocated their money.
The crash was worse for most investors than what the market showed, especially when you consider there were no index funds to invest in back then.
Right now the stock market isn’t close to a 30%+ bear market just yet but the difference between the market and the glamour stocks is just as stark as it was back then.
Take a look at the current drawdown on the S&P 500 (-8%) versus the losses in cloud computing stocks (-30%), biotech (-27%), new IPOs (-41%), SPACs (-48%) and small (-60%) and large (-54%) innovation companies.
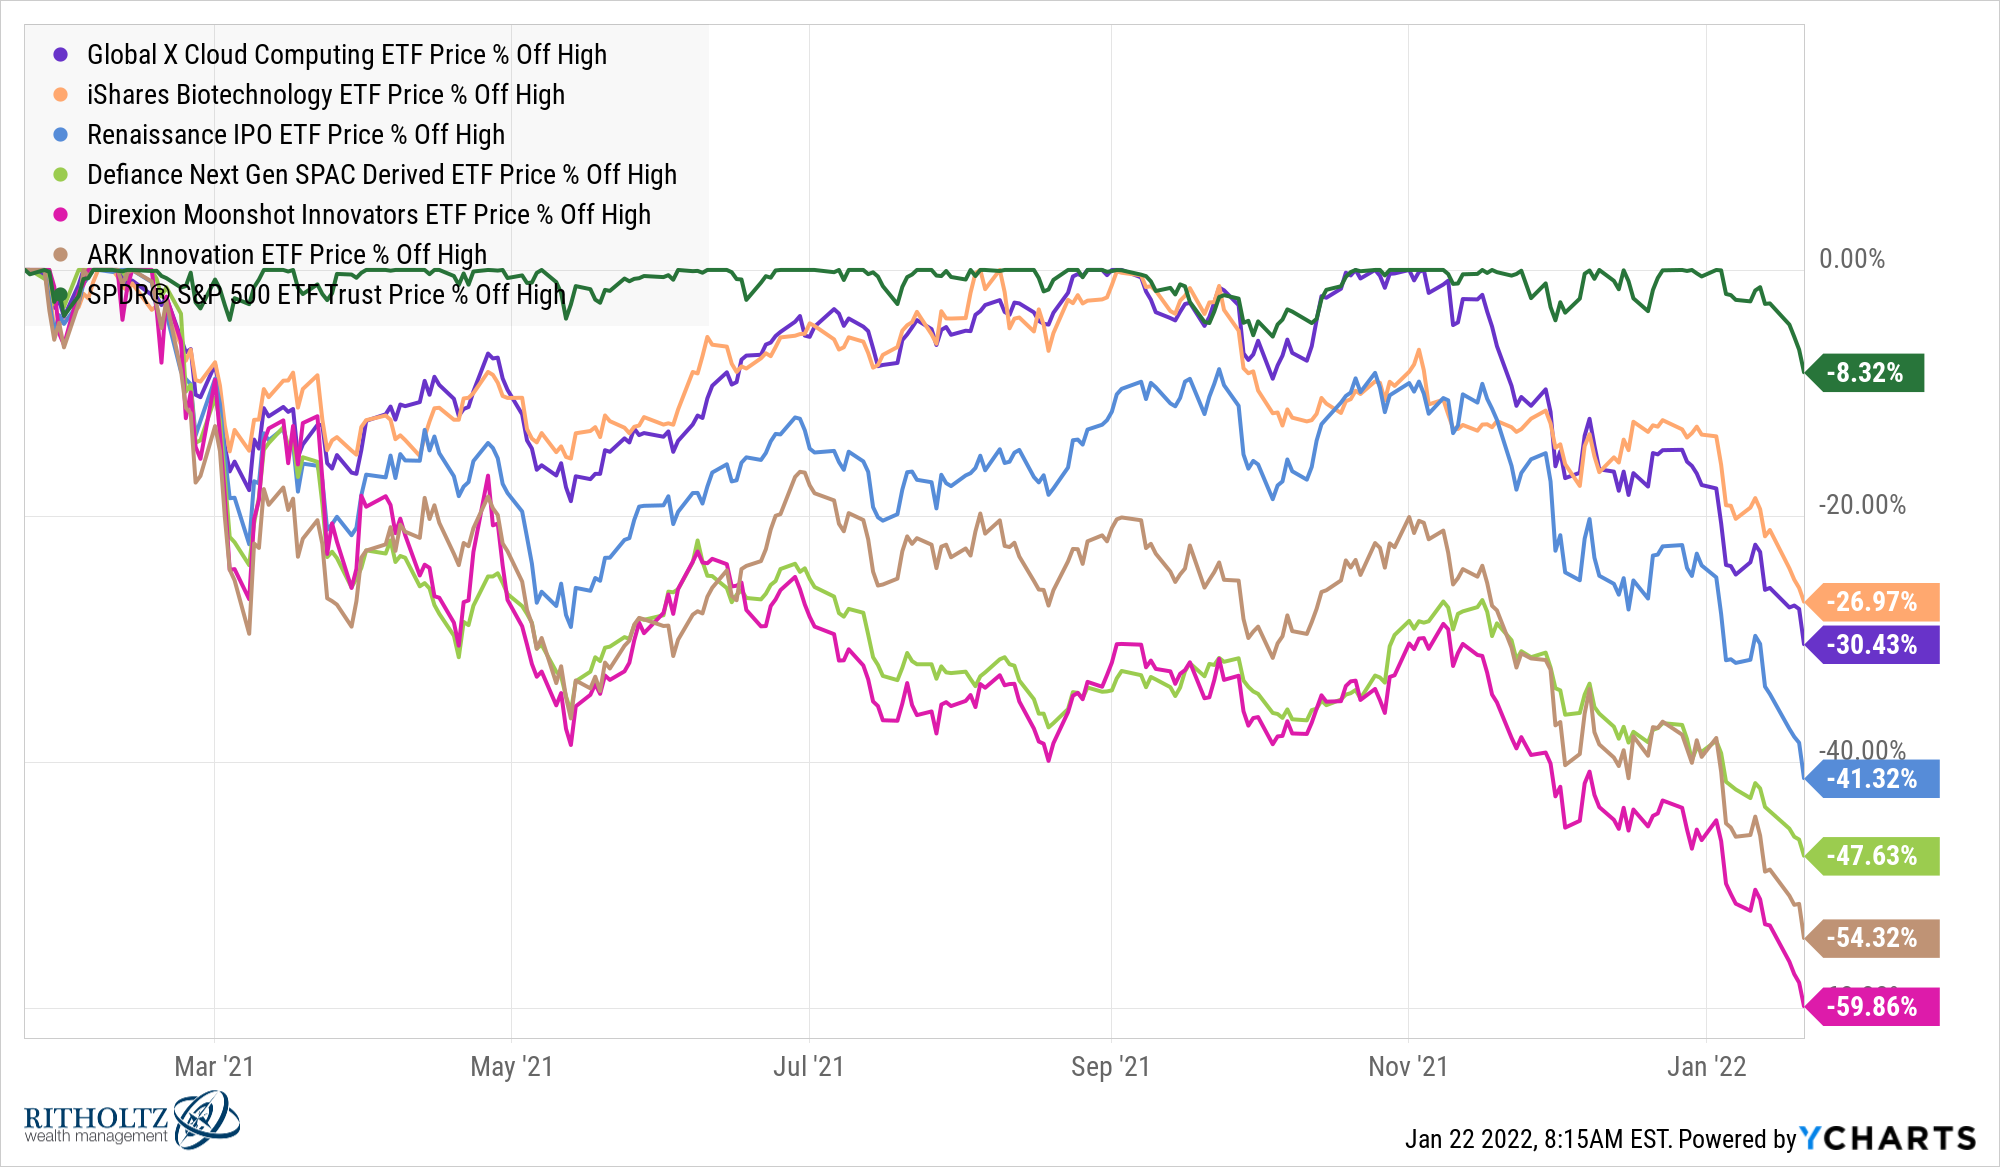
The S&P 500 isn’t even down 10% from all-time highs while growth stocks are getting annihilated.
And that’s not the only similarity between now and the Go-Go Years.
Here’s what I wrote about Jerry Tsai in a piece about Cathie Wood when ARK was on fire:
In Big Mistakes, Michael Batnick profiles Fidelity’s Jerry Tsai, who was basically the first star fund manager in the Go-Go Years of the 1960s.
Investors went crazy for mutual funds in general as total fund assets grew from a little over $1 billion in 1946 to over $35 billion by 1967.
But Tsai stood out from the crowd. After a run of outperformance that began in 1958, Tsai saw the number of shareholders in his fund sextuple from 6k to 36k from 1960 to 1961.
After leaving Fidelity in the mid-1960s to start his own fund, Tsai got crushed in the bear market of 1968-1970 which saw momentum stocks get killed.
Assets fell 90% over the next few years and Tsai’s fund would go on to have the worst 8-year track record of any mutual fund in history to that point.
I’m not ready to put the nail in the coffin of Cathie Wood’s fund just yet but the parallels here are striking.
According to Jason Zweig, the ARK Innovation Fund had just $12 million in assets by the end of 2016. After a string of amazing performance numbers, it was just shy of $2 billion by yearend 2018. Then $13 billion poured in from the tail end of 2020 through early-2021 following an impressive performance streak.
Since then the fund has gotten shellacked.
There is never a single reason for the stock market or any particular sector of the stock market to get killed.
It would be crazy to assume inflation, rising rates and the Fed’s potential rate hikes aren’t having an impact on growth stocks right now.
But it’s also possible the biggest reason these stocks are getting creamed is due to the fact that these companies went on an insane run and became wildly overvalued.
Investors all saw the charts like this one about the adoption of e-commerce because of the pandemic:
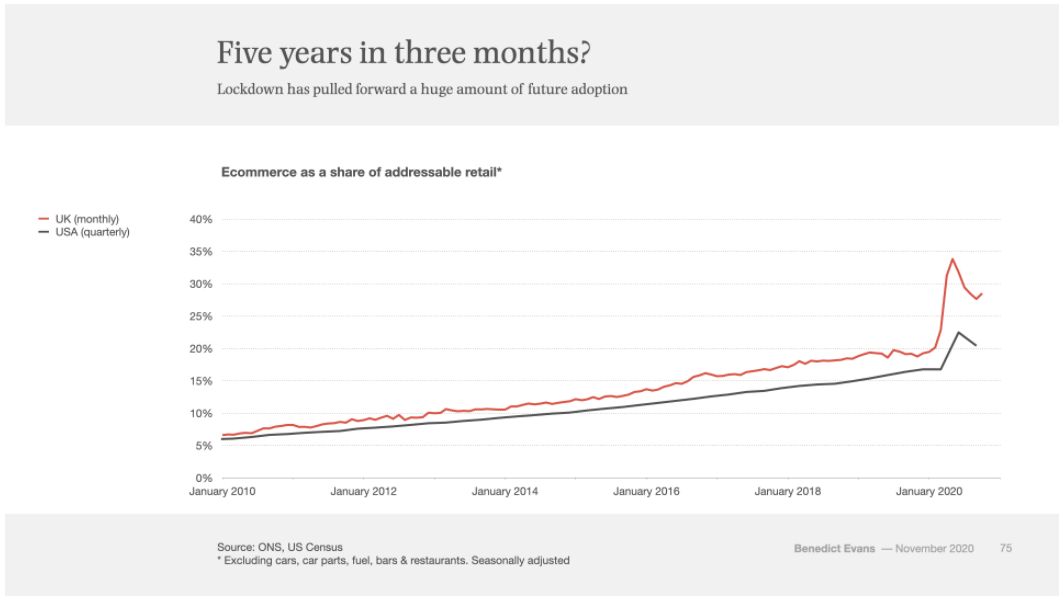
How could you not go overboard after seeing this?
The pendulum always swings too far in both directions, especially when technological innovation is involved. In 2020 and early-2021 that pendulum went too far to the upside.
Now that excitement has quickly turned into panic once the selling began en masse.
That’s why I wouldn’t want to offer a guess as to when this current correction will end.
Will the growth stock pain bleed into the rest of the market?
Will we see some funds blow up?
Will margin calls create a cascade of selling?
Or is the worst behind us now that the most speculative names have already gotten crushed?
I don’t know and neither does anyone else.
All I know is growth stocks were given a long leash coming out of the Corona crash.
That’s not the case anymore and the Go-Go Years feel like they might be over for a while.
Further Reading:
Why Financial Manias Persist
1Thankfully I have the IMDb for that.

