The U.S. stock market is up 13.5% per year since 2009.
Valuations have been well above historical averages this entire time and moving ever higher.
Interest rates are about as low as they’ve ever been.
Add all this up and it’s hard to argue with the idea that investors should lower their return expectations going forward.
The problem with this equation is you could have said this very same thing in 2012, 2013, 2014, 2015 and so on yet it hasn’t happened. The low return environment that seemed like a sure thing has been nothing but high returns.
Eventually, it will happen though. Returns won’t stay this high forever. It’s not exactly going out on a limb to say that as long as you don’t place an exact time frame on that prediction.
The most recent forecast for stock and bond returns from money manager GMO, however, is going out on a limb…and not a very sturdy one: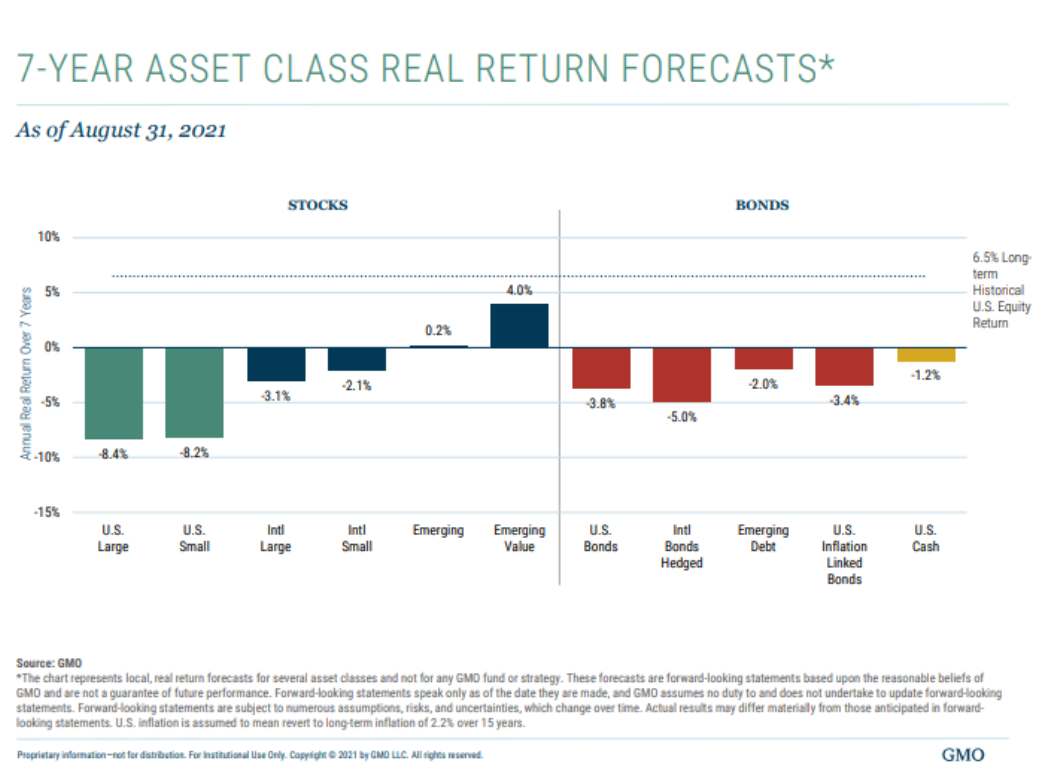
GMO’s forecasting model is predicting annual returns over the next 7 years of -8.4% for U.S. large cap stocks and -3.8% for U.S. bonds.
These returns are so awful, over the entire 7 year period that would leave investors with total returns of -46% for stocks and -24% for bonds.
For a 60/40 portfolio, that’s a return of -37% in total. A $10,000 investment under this scenario would leave investors with around $6,300 in their portfolio after 7 years.
Not great.
You could quibble with the assumptions used in GMO’s models, and I do, but looking at these downright terrible return forecasts got me thinking about the worst stock and bond returns in history.
Here are the rolling 7 year returns for the S&P 500 and 5 year treasury bonds going back to 1926:
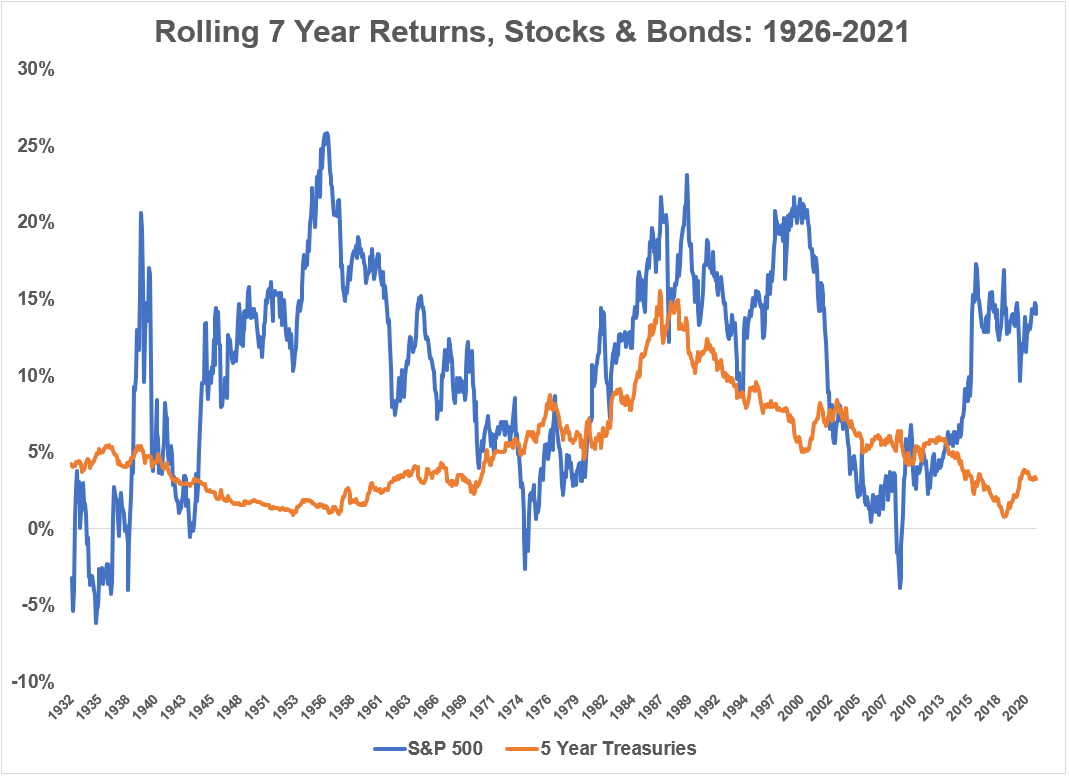
The worst 7 year return for U.S. stocks was -6.1% per year.
The worst 7 year return for bonds was +0.8% per year.
Intermediate-term bonds have never had a 7 year period with negative returns. Stocks have been positive in 95% of all rolling 7 year periods in this time.
That’s a pretty solid track record.
So we’ve never seen returns as bad as GMO is predicting for stock or bonds in the past 100 years or so.
But that’s on a nominal basis. GMO’s model is showing annual returns on a real basis, after accounting for inflation.
Here are the real returns:
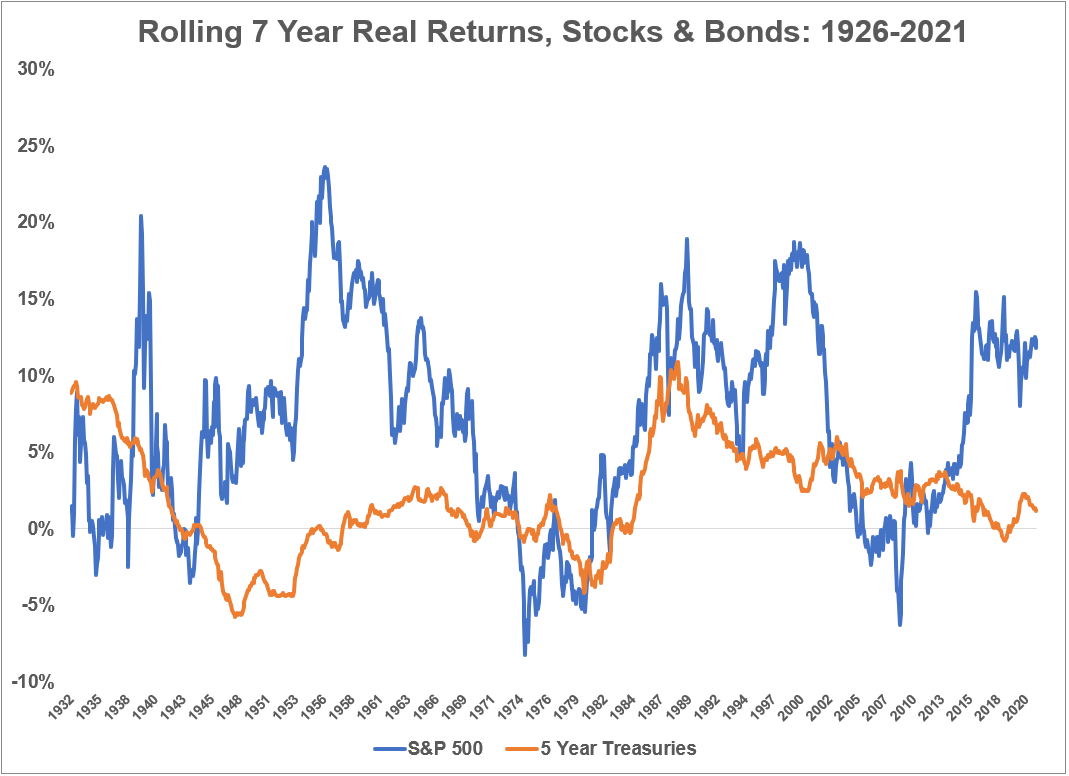
Now we see some negative returns for bonds and a handful of nasty periods for stocks.
The worst real annual return for stocks over 7 years is -8.3%. For bonds it was -5.8% per year.
So now GMO is in the ballpark but they’re basically predicting the worst real returns ever for stocks and pretty darn close for bonds.
It is worth noting the environments that led to the worst returns for each asset class.
The worst 7 year return for bonds was for the period ending in January 1948. The biggest reason for such low real returns in this time frame was the sky-high inflation following WWII.
Interest rates were capped to help fund the war. The annual inflation rate hit as high as 20% for a time after WWII. Low rates combined with high inflation makes for a prime environment for bonds to get shellacked.
The worst 7 year return for stocks was for the period ending in the fall of 1974. These returns resulted from a 50% crash in the stock market in 1973-74 along with inflation reaching double-digit levels.
So if we’re giving GMO’s return forecasts any credence, the real killer would have to be not only low nominal returns along with a crash in the stock market but also painfully high inflation.
That’s not out of the question but requires a market environment that’s extremely rare.
If we’re assuming a stock market crash is coming at some point in the next 7 years, and it very well could be, you would figure bonds would do well in that scenario.
The Fed would be lowering interest rates and you’d have a flight to the safety of bonds.
It would basically have to be a stock market crash caused by rising rates and high inflation.
However, GMO is predicting horrific returns for both stocks and bonds.
Have stocks and bonds ever had such dreadful returns at the same time?
Easily the worst time for both stock and bonds during the same period occurred in the 7 years ending in March 1980.
Stocks returned -5.5% annually on a real basis while bonds were down 4.1% per year after accounting for inflation.
So it is possible for both bonds and stocks to perform terribly on a real basis even though it’s a low probability event.
Since 1926, less than 7% of all rolling 7 year periods saw real returns on both stocks and bonds end up negative simultaneously.
And of that 7% or so which saw both stocks and bonds have negative real returns concurrently, 77% of the time it occurred between 1974 and 1981 when inflation was running at an annual rate of 9.4%.
Stocks are a wonderful hedge against inflation over the long-run but it would be hard for most financial assets to do well when inflation is running at nearly 10% per year for an extended period of time.
I’m not saying GMO’s return forecast is impossible. I’ve learned to never say never when it comes to the markets.
Just because something has a low probability of occurring, doesn’t mean you can completely write it off.
But it is worth understanding the market environments that have produced the worst stock and bond returns in history.
Further Reading:
How to Hedge Against Inflation
