See if you can spot the largest one year spike in U.S. housing prices on record:
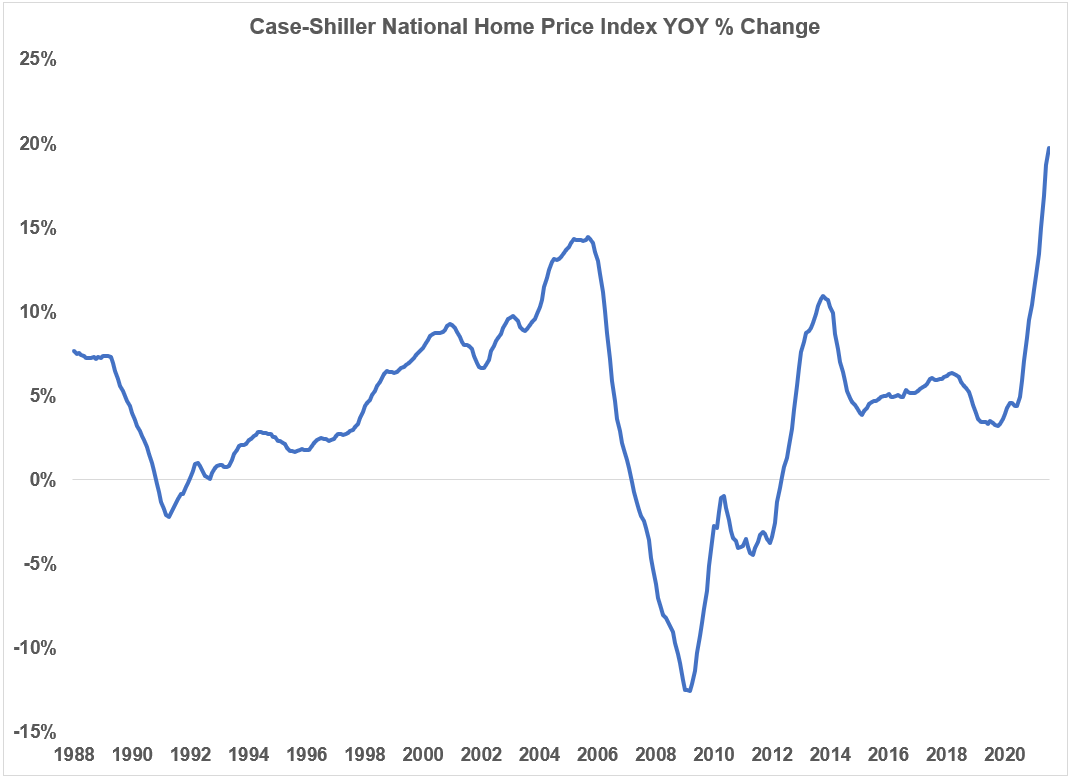
Give up?
A 20% gain for national home prices over a one year period is absolutely nuts.
The Wall Street Journal is beginning to worry about how this is impacting affordability:
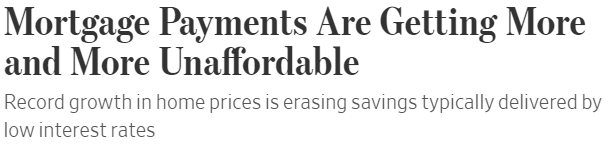
Here’s their takeaway:
House prices are rising at a record pace but incomes aren’t keeping up, which is making home ownership less and less affordable.
The median American household would need 32.1% of its income to cover mortgage payments on a median-priced home, according to the Federal Reserve Bank of Atlanta. That is the most since November 2008, when the same outlays would eat up 34.2% of income.
Basically, housing prices are rising much faster than incomes.
This doesn’t look so bad when compared with past values until you consider the high watermark here was the peak of the housing bubble:
My beating a dead horse argument with houses prices over the past year or so is that you can’t begin to compare prices to previous levels unless you also compare interest rates.
Back in January, I wrote a piece called What if U.S. Housing Prices Aren’t as High as They Appear? At that time, the median price for an existing single-family home was $308,000. The latest reading of that price is now $367,000.
In that time, mortgage rates are more or less unchanged. Assuming a 20% down payment with a 3% fixed rate mortgage over 30 years would lead to a monthly payment of $1,038 for a $308,000 home. Using those same assumptions for a $367,000 home bumps that payment to $1,237 a month.
So in less than a year, housing prices alone would have added around $200/month to the median housing payment.
That’s not the end of the world but $2,400 a year could put a dent in the budget of many households. And obviously, prices are much higher in many areas of the country.
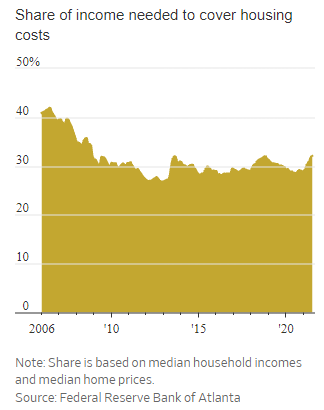
In my original piece from January, I calculated the monthly mortgage payment using the prevailing mortgage rates going back to 1989. Here is the updated chart:
You can see this number is now at its highest level in this time series, just barely eclipsing the 2006 high.
Of course, a dollar in 2006 is not the same thing as a dollar today because of inflation. One dollar in 2006 would be worth around 70 cents today because of inflation.
Here is the updated chart using inflation-adjusted monthly payments:
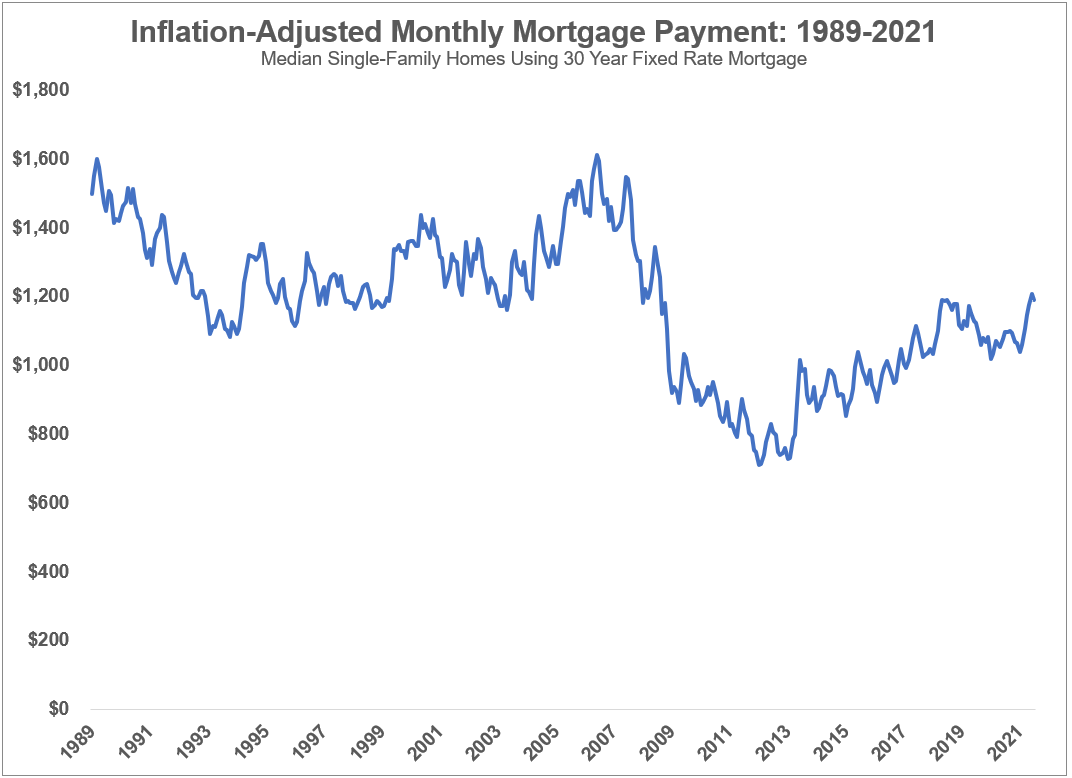
Now things don’t look so bad. On an inflation-adjusted basis, monthly payments are still below 1989 levels.
The standard rebuttal to this data is that monthly payments don’t take into account higher down payments and property taxes but most people figure out how much they can afford by looking at their monthly outlay.1
The problem for many people is housing prices are now dwarfing gains in their income levels. Bill McBride recently updated the house price to median income ratio to show how this is playing out:
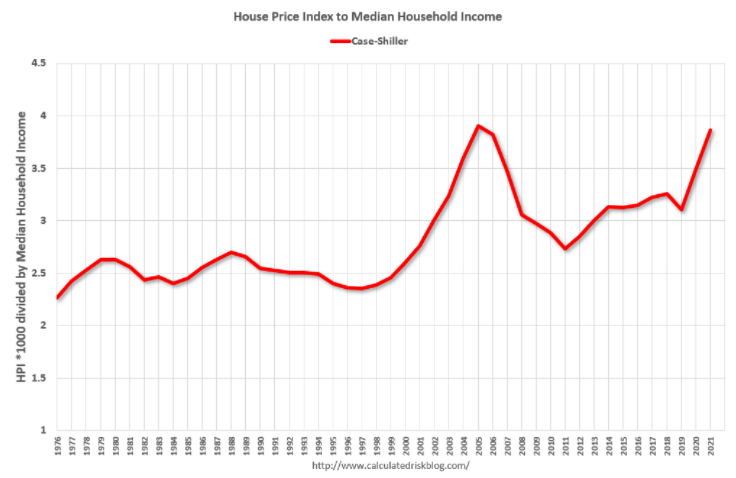
This is another measure that’s closing in on the housing bubble peak.
By this measure, things look pretty clear-cut. Housing prices are out of whack with reality.
But again, prices have to be put into context.
McBride created his own housing affordability price index to do just that. He assumes a 15% down payment with a 30 year fixed rate mortgage and 2% of the purchase price to cover property taxes, insurance and maintenance.2
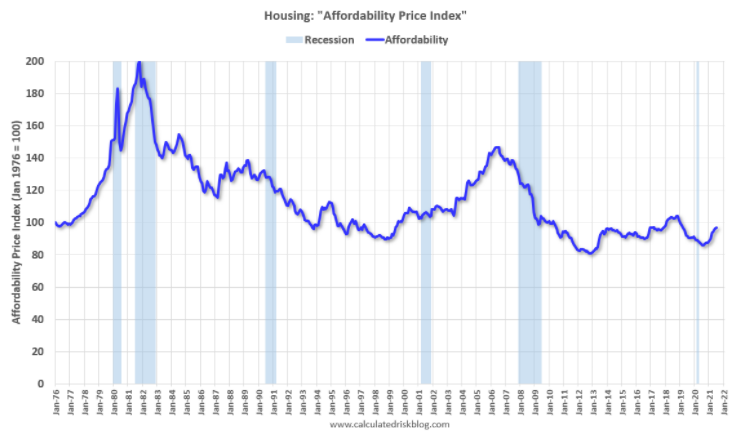
This number is creeping up but still well below the housing bubble and not even close to the ridiculously high-interest rate levels of the 1980s.
By some measures, we’re back at housing bubble levels. By other measures, things don’t look so bad.
Something for everyone in these numbers I suppose.
It is worth noting that these affordability numbers say nothing about the timing of your housing purchase in terms of it being a good deal going forward. Even though rates were high in the early-1980s, it was a great time to buy because housing prices were far lower and you could eventually refinance as rates fell (not that people knew that at the time).
Housing prices are rising for a number of reasons:
- Household formation from the millennial generation
- Increased demand to move due to the pandemic
- Investors looking for yield and inflation protection
- Extremely low mortgage rates
The one variable that could throw a wrench into this equation would be higher mortgage rates.
In my example from above, a $308k house at 5% mortgage rates would be a monthly payment of $1,322. A $367k house would be $1,576/month. Those are increases of around $300/month versus 3% mortgage rates.
Rising rates are even more impactful than rising prices on your monthly payments.
If rates were to rise substantially, you would expect housing prices to fall, at least in theory.
The worst-case scenario for would-be first-time homebuyers would be for mortgage rates to rise while prices don’t fall. Demand would surely soften if rates rise past a certain threshold but I have no idea what that threshold is. And there is no guarantee housing prices would immediately fall if rates do rise.
There are certainly parts of the country where buying a house is a losing proposition for many Americans right now. That doesn’t necessarily mean it’s unaffordable for everyone everywhere but this system isn’t really built for prices to rise 20% across the country.
Prices won’t rise at that clip forever but I would be more worried about rising mortgage rates than rising prices if I was in the market for a house right now.
Further Reading:
Why U.S. Housing Prices Aren’t as Crazy as You Think
1It’s also important to note you don’t have to put 20% down to buy a house. As George Pearkes recently noted on Twitter, the minimum down payment for the median-priced home in the U.S. right now is $12,233 for a first-time buyer via an FHA loan.
2Yes, I know these numbers are not the same across the board depending on where you live.

