Here’s a story from 2014 about why the IPO is dying. The list was basically — Sarbanes-Oxley regulations, Reg FD, more venture capital money, etc.
It’s true there was a dry spell for IPOs there for a while but like most things in the market, just wait long enough and the cycle is sure to turn at some point. Like many trends from the pandemic, it appears 2020 was the year this cycle turned (although you could make the case it was happening already).
Never say never but I don’t think we’re ever going back to the days of the late-1990s with 7,000 public companies in the United States. There is simply too much venture money floating around. But it appears private investors are finally ready to cash out and IPOs are born again.
Here’s a piece I wrote at Fortune on the rebirth of IPOs.
*******
When it was first developed in 1974, the Wilshire 5000 Equity Index had around 5,000 stocks and was representative of all U.S. stocks with readily available price data. The name rang true at the time when it came to the number of stocks in the market, but that number has fluctuated wildly since then.
By 1980, there were fewer than 4,000 stocks remaining in the index. The number of public companies rose steadily throughout the 1980s, breaching 6,000 names by 1988. Then in the late 1990s, the number of stocks took off, hitting an all-time high of more than 7,500 by 1998. Since that time, the number of stocks in the Wilshire 5000 is down by more than half to just 3,500. The last time there were actually 5,000 stocks in the index was 2005.
There are a number of reasons this figure can change over time. Mergers and acquisitions are a big one. Many companies go out of business over time. And then there are private companies that list their shares and go public.
Initial public offerings (IPOs) were the main reason for the surge in numbers in the late 1990s. It is worth noting here, too, that the majority of companies going public back in the 1990s during the dotcom bubble were of the microcap variety, the smallest market cap classification and one that tends to encompass many companies with flimsy business models. According to Vanguard, there were around 2,000 microcap companies in 1979, more than 4,100 by 1997, and just over 1,500 by 2014. Most of the microcap companies that went public during the 1990s boom time went bust.
However, there has also been a dearth of IPOs following the dotcom crash. More companies have been staying private for longer, which has robbed many public market investors of the gains they would have experienced in the past.
For example, when Amazon went public in 1997, it had a market cap of around $438 million. When Facebook went public in 2012, the market cap was more than $100 billion. A combination of increased regulatory burdens and more institutional money than ever in the private markets has led many companies to stay private longer than they did in the past. This is one of the main reasons the number of IPOs has been stagnant for quite some time.
It appears 2020 is the year that trend may finally be changing course.
According to Renaissance Capital, 2020 was a banner year for initial public offerings. Even though capital markets more or less shut down in March and April of last year and companies couldn’t go on their standard roadshows to sell their stock, IPOs were up 36% from 2019, while the proceeds from those deals were up nearly 70%.
And the market for new companies has remained hot in 2021.
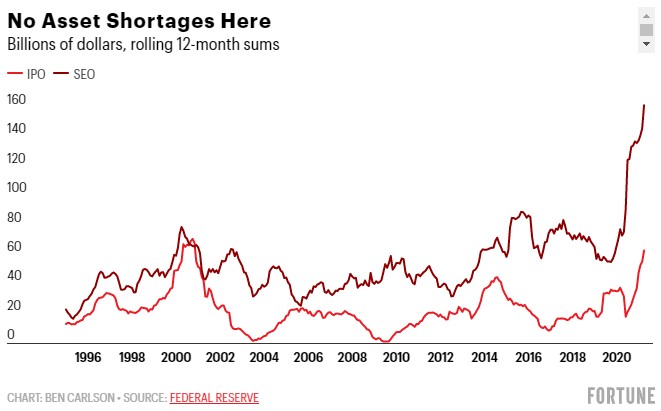
Through March 2021, the trailing 12-month proceeds for IPOs in the United States were nearly $64 billion, the highest level since the tail end of the dotcom boom. And secondary share offerings are off the charts as companies have sold more than $162 billion worth of additional shares through the end of the first quarter.
Bloomberg data shows the first six months of this year have seen $350 billion raised through initial public offerings globally, a new record.
The performance of this new batch of IPOs is also encouraging.
Typically, newly public companies see a huge spike on day one of trading but then go on to underperform the market. IPO expert Jay Ritter has studied more than 8,000 IPOs going back to 1980. The average first-day return for those stocks was 18%. But over the ensuing three-year period after going public, these companies went on to underperform the market by nearly 19%. So IPOs have historically not been great investments over the long haul as a group if you didn’t have access to shares right as they came public.
Today’s newly traded public companies are trying to buck that trend. The recent crop of IPOs have been crushing the market of late. The Renaissance IPO ETF (IPO) is up more than 116% since the start of 2020 versus a gain of 36% for the S&P 500. This fund holds many well-known brands including Airbnb, DoorDash, Coinbase, and Roblox.
This is still a relatively short period of time in the markets, but it is possible that because these companies are staying private longer they are higher quality once they do come public.
For years, many investors bemoaned the fact that more companies weren’t coming public. This dynamic could only last so long since the private investors in those companies needed to see some liquidity on their shares to cash out. It appears 2020 was the year the IPO market finally opened up the spigot.
This is a welcome trend for investors who have been clamoring for the chance to invest in many of the most well-known private companies.
This piece was originally published at Fortune.

