Some market-related stats I’ve been compiling for a while:
1. The period ending in March 2020 saw long-term bonds beat the U.S. stock market for 25 years. From the spring of 1996 through March 2020, long-term government bonds returned 8.2% annually versus a return of 8.0% per year for the S&P 500. And they did so with one-third less volatility.
Most of the time stocks beat bonds over the long-term but not always.
2. In its 45 years of existence, the Bloomberg Barclays Aggregate Bond Index has had just 3 down years. Those 3 losses were just -2.9%, -2.0% and -0.9%. That’s 93% of all years with positive performance. The annual returns have been 7.3% with just 5.2% volatility without a single loss of more than 3% in a calendar year.
The bond bull market since the early-1980s is a historical outlier unlike anything we’ve ever seen or will see again in the future.
3. Long-term bonds lost more than 50% of their value after inflation from 1950-1981. This was the opposite of the current bond bull market. It was a time of high inflation and rising rates.
On a nominal basis bonds were still up so this was all inflation eating away the returns.
4. Japanese stocks returned 23% per year over two decades in the 1970s and 1980s. That would have turned an initial $10k investment in 1970 into $610k by 1989.
In the 1970s the MSCI Japan Index was up 17.4% per year. It followed up those wonderful returns by gaining close to 29% per year in the 1980s.
This helps explain why Japan has returned roughly 1% per year ever since then.
5. Holding cash in a savings account would have outperformed the U.S. stock market one out of every three years since the late-1920s. Despite this fact, the U.S. stock market has returned close to 10% per year over these 9+ decades while cash (3-month t-bills) is up around 3% per year in that same time.
6. Real housing prices in the United States were flat for more than 100 years from 1870 through 1975. Data from Robert Shiller shows housing prices went nowhere for more than 100 years in the United States:
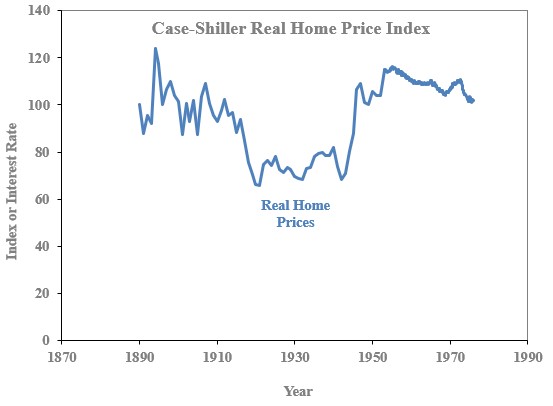
Housing is notoriously difficult to calculate actual returns on and who knows how reliable data from the 19th century is on housing.
Since 1975, housing prices have doubled on a real basis.
Real estate is going bonkers right now but it hasn’t always been like this.
7. Gold compounded at more than 35% per year from 1970 through January of 1980. That’s a total return of more than 1900%. From January 1980 through today, gold is up more than 150% or a little more than 2% per year.
This is fun with numbers, but it’s true.
8. From 1979-1999 the U.S. stock market was up nearly 3000% in total. That was a pretty good run.
9. From 2000-2008 the U.S. stock market was down 28% in total. This was the other side of that pretty good run.
Annual returns from 1979-1999 were almost 18% per year. From 2000-2008 annualized returns were -4%.
The stock market giveth and the stock market taketh away.
10. It would have taken just $400 invested in Bitcoin in January of 2013 to hit $1 million today. I typically hate these stats but this one is incredible (and only mildly annoying since probably less than 0.5% of the population even knew how to invest in Bitcoin back then).
11. One million dollars invested in Enron or Lehman Brothers shares would be worth $0 today. Just trying to keep you honest.
12. The worst 10 year total return for the U.S. stock market was a loss of 40%. This was from the peak of the market in September 1929 just before the onset of the Great Depression.
Not great.
13. The best 10 year total return for the U.S. stock market was a gain of 597%. That was good enough for annual gains of more than 21% starting in the summer of 1949.
14. Inflation totaled 98% in the 1970s. One dollar in 1970 would be worth 48 cents by 1979. That’s an annual run rate of more than 7% per year.
15. Inflation was -19% in the 1930s. This is also known as deflation, which came in at more than 2% per year. One dollar in 1930 would be worth around one dollar and twenty-three cents by 1939 but I’m not sure people back then felt any richer.
16. The Dow closed at 381 in September 1929. It wouldn’t cross that mark again until November 1954. Most people more or less gave up on the stock market after the 80%+ crash during the Great Depression.
It was impossible to invest in the Dow since index funds didn’t exist or reinvest your dividends back then, but if you could have done these things, you would have earned nearly 6% annual returns in this time.
Dividend yields were much higher then so not all was lost.
Please feel free to send your complaints about any of these stats to my editor (me) after reading.
