2020: My brokerage acct is crushing all of my index funds why in the world do I own index funds again?
2021: My index funds are crushing my brokerage acct why in the world do I own individual stocks again?
— Ben Carlson (@awealthofcs) May 6, 2021
From the bottom in late March of last year, the U.S. stock market was up nearly 75%. This was the best 12 month return ever recorded since 1950.
Nearly 96% of stocks in the overall U.S. stock market showed positive returns in that time.
It’s highly like we will never experience a 12 month period of returns like that again in our lifetime. For all intents and purposes, the one year period following the bottom of the Corona Crash was the easiest environment in history to make money in the stock market.
If you think this type of market is normal, you’re sorely mistaken. It’s not always going to be this easy.
In fact, the stock market has already stopped being so easy in 2021. While the S&P 500 just hit its 26th new all-time high this year alone (including another new high at the close on Friday), a number of stocks are currently getting crushed.
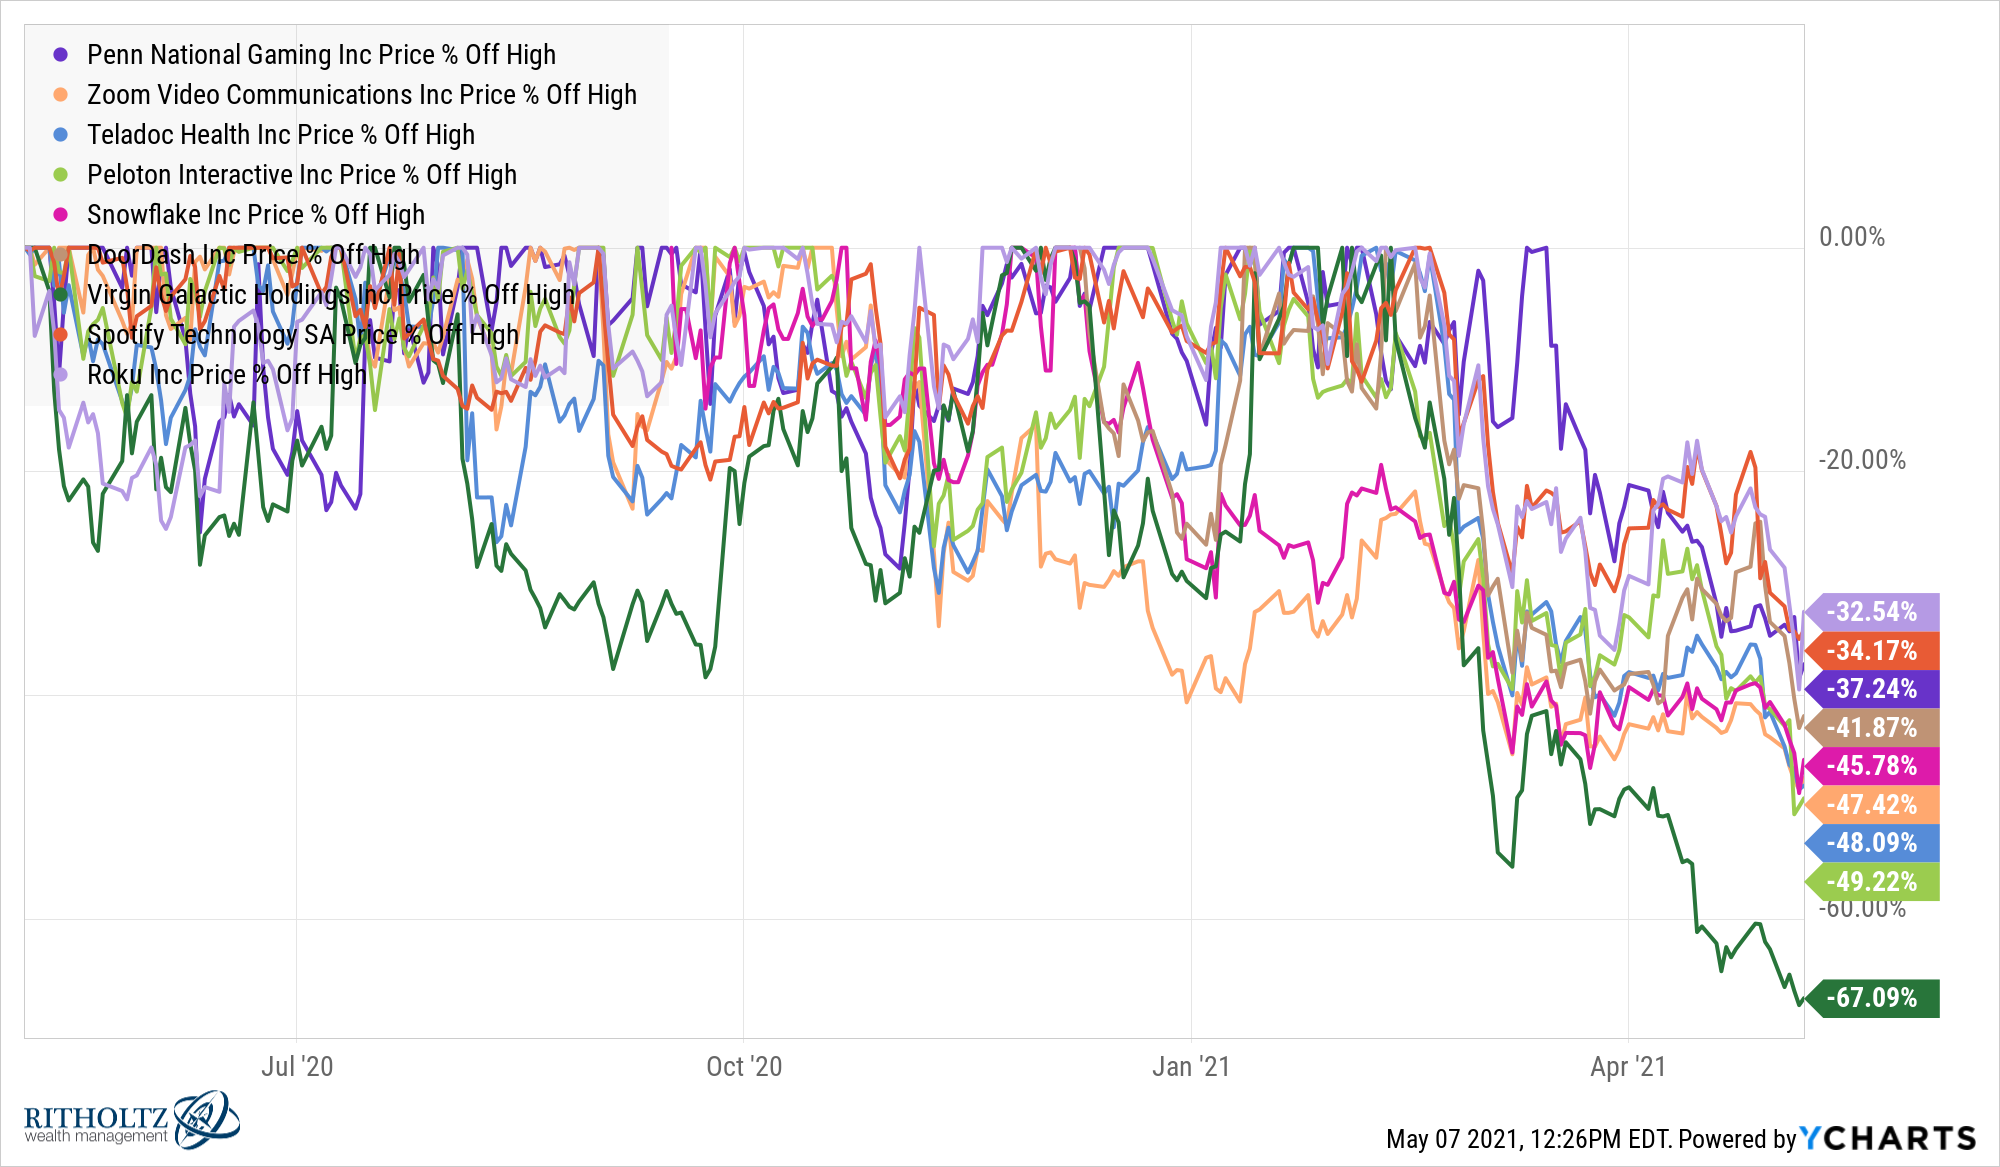
And it’s not just any stocks; it’s many of the stocks retail investors flocked to last year following the crash:

2020 retail darlings such as Virgin Galactic (-67%), Peloton (-49%), Teladoc (-48%), Zoom (-47%), Snowflake (-46%), DoorDash (-42%), Penn National (-37%), Spotify (-34%) and Roku (-33%) are all getting massacred while the stock market is powering to new highs.
It is worth noting many of these stocks are still sitting on massive gains depending on when you got into them. This is a good reminder that no stock rises up and to the right on a straight line forever.
It’s also true that these popular names aren’t alone when it comes to the carnage in certain individual stocks right now.
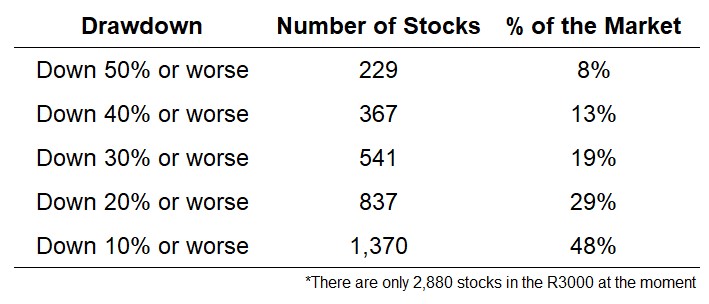
Using data from YCharts, I drilled down into the Russell 3000 (a good proxy for the total U.S. stock market) to see how many stocks currently have double-digit drawdowns from their 52 week highs. The list was bigger than I expected:

The stock market is knocking out new highs on the regular and up 13% in 2021 but nearly one-third of all stocks are in a bear market as we speak. Almost half of all stocks are in correction territory, down 10% or more. And 1 out of every 12 stocks is down 50% from their 52 week highs right now.
But maybe I shouldn’t be so surprised about this data. This is actually the norm in the stock market.
Even when the stock market overall is up in a given year, there are almost always going to be a large number of stocks within the index that are down.
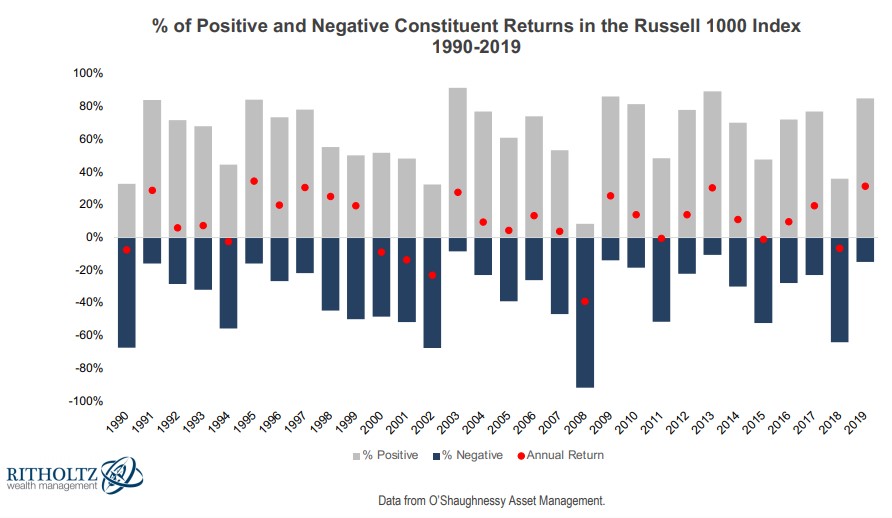
O’Shaughnessy Asset Management produced this excellent chart which shows the number of stocks with gains and losses each year from 1990 through 2019 along with the corresponding annual return for the Russell 1000 Index in that time:

Even when the market is up there are always a number of stocks that are down.
For example, even in a blowout year like 2017, when the Russell 1000 was up almost 22%, nearly one-quarter of all stocks in the index experienced losses. There are no years when the index is up and no stocks are down. That’s how averages work in the stock market.
Market action from the bottom of the Corona Crash was the outlier. Investing in the stock market is rarely that easy.
The current environment is the norm.
If you own a handful of individual stocks that are getting killed at the moment, understand this is how it works.
Investing in individual stocks is hard. Large drawdowns are more frequent. Bigger gains are possible but so are bigger losses.
There are times when investing in index funds will make you feel like a fool. Then there are times when investing in individual stocks will make you feel like a fool.
Pick your poison.
Nothing works always and forever.
Further Reading:
The 4 Types of Robinhood Traders
What Happens After the Stock Market is Up Big?
