I feel pretty comfortable in saying 2020 has to be the only time in history where the U.S. stock market has hit 30 new all-time highs (and counting) during the same year as a pandemic and the worst quarterly GDP drop in history.
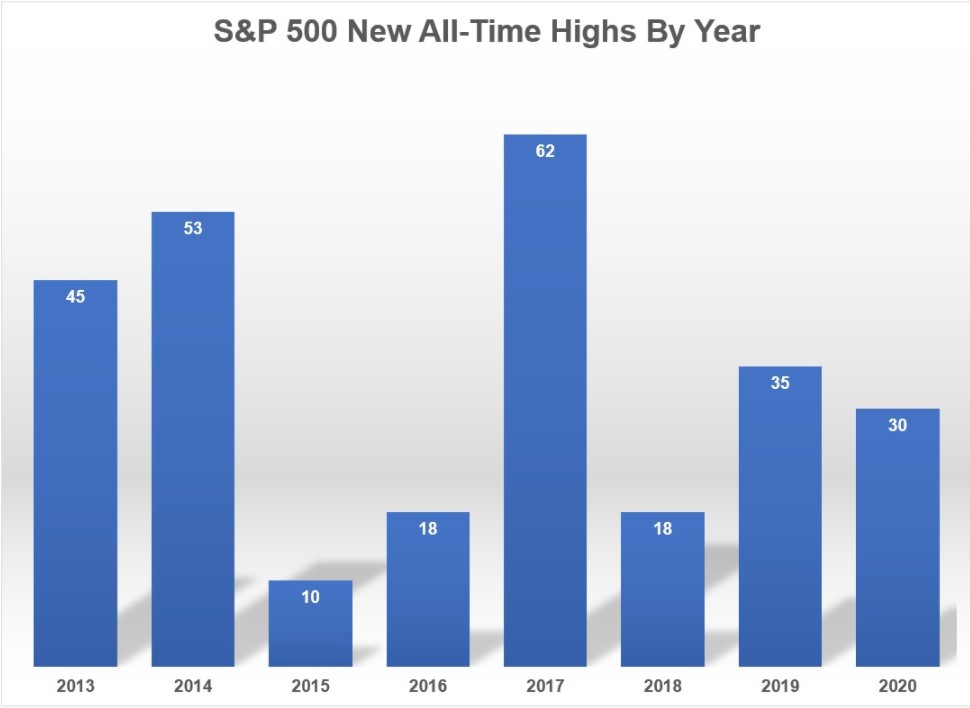
Since reclaiming the highs from 2007 following the Great Financial Crisis, the S&P 500 has now seen more than 270 new all-time highs. That’s roughly 14% of all trading days in that time where stocks have closed at an all-time high.
Over the past 100 years or so the stock market has hit all-time highs on around 5% of all trading days. So it makes sense those new highs tend to cluster during a bull market when you have droughts like we experienced from October 2007 through March 2013 with nada.
This is one of the reasons investing at all-time highs can play head games with you. Invariably, one of those all-time highs will be THE high, at least for a while.
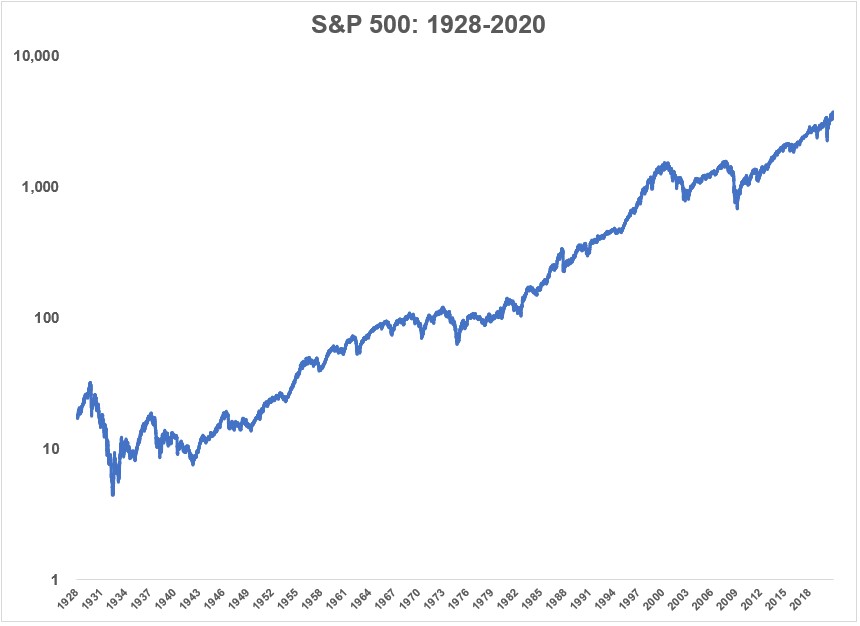
You can see just from eye-balling a long-term chart of the S&P 500 that there have been extremely long wait times where the market was underwater from a previous peak:
These are the longest droughts to reach new highs from prior peaks:
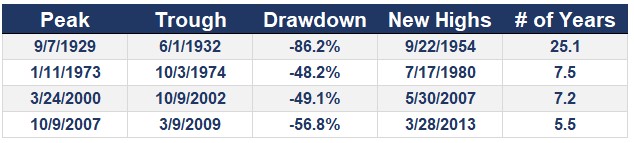
This shows how many years it took to reach new highs from a previous peak, with the obvious loser here being the Great Depression. It is worth pointing out these are price levels only and do not include dividends reinvested.
By contrast, it took just 6 months from the prior peak in February to hit a new peak for the S&P 500 in the roundtrip this year.
Just to complicate things a little more, a recent report from JP Morgan looks back at the past 30 years in the stock market to show how investing at all-time highs isn’t as scary as it seems.
They looked at the average returns of investing any day at random since the start of 1988 and comparing those returns to investing only when the stock market is at all-time highs. Shockingly, the returns 1, 3 and 5 years out were better on average investing at all-time highs than any other days:
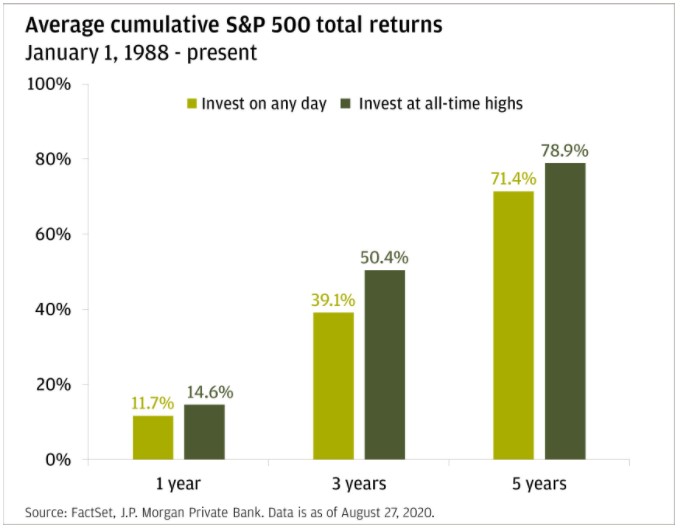
According to my calculations, there have been more than 600 all-time highs since the start of 1988, or roughly 7.3% of all trading days.
So this isn’t the kind of backtest you could put into practice. It’s to show you that investing at all-time highs doesn’t have to be a losing proposition. In fact, all-time highs tend to beget all-time highs simply because that’s the way the markets work during a raging bull.
This is why investing in the stock market can be such a wonderful and scary proposition. Most of the time, things will work out fine and stocks will continue to rise.
But some of the time, a minority of the time, stocks will fall and take a long time to make you whole again as an investor.
So it goes with risk assets.
Just know that picking THE peak is one of the most impossible things to do as an investor.
Further Reading:
How Long Does It Take To Make Your Money Back After a Bear Market?

