When it comes to the markets or economy, presidents get far too much blame when things go poorly and far too much credit when things go well.
There’s no way one person could singlehandedly control the $30 trillion U.S. stock market or $20 trillion U.S. economy.
But that doesn’t stop us from trying especially when the election rolls around every 4 years.
Sure, the president can have an impact on sentiment and tax rates do play a role in the decisions consumers and businesses make but where we are in the cycle typically has far more to say in regards to the performance of the markets over anyone’s time in the Oval Office.
These things require context.
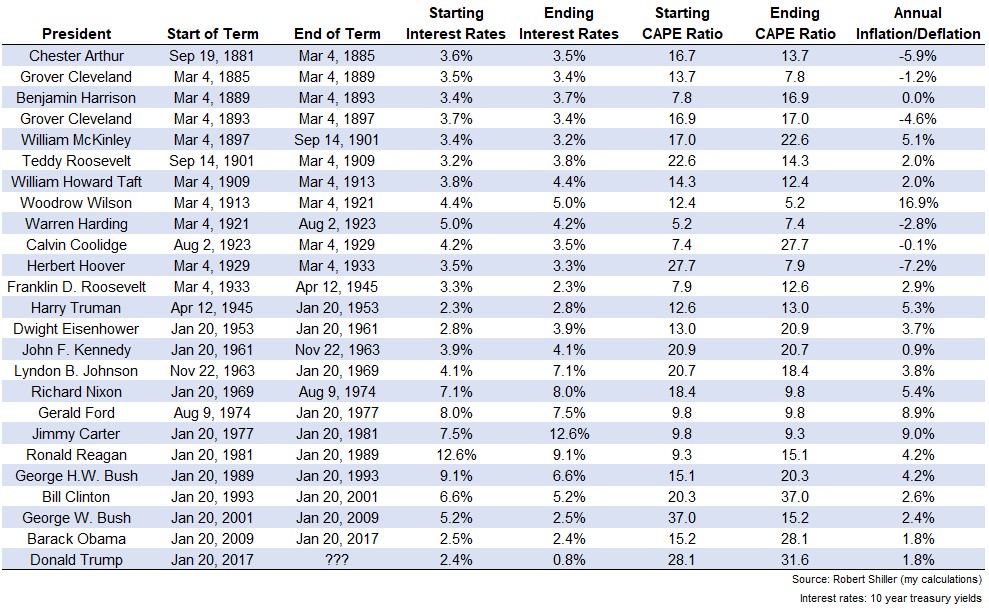
To provide said context I went all the way back to the 21st president of the United States, Chester Arthur to see what things looked like for incoming presidents in terms of interest rates and valuations when they took over along with the inflation/deflation while they were in office:
Some observations on this data:
Did I need to go all the way back to the Arthur administration in the 1880s with this data? No but the fact that Robert Shiller has data going back this far made me think it can’t hurt anyone. CAPE ratios from the 1800s are basically useless but interesting nonetheless.
Look at the wild swings back and forth between inflation and deflation back in the day. Things have been relatively calm on that front since Reagan took office in the early-1980s. It would be fascinating to see what the investor reaction to higher than expected inflation.
Looking at the starting and ending valuations can be instructive to understand how things changed during a president’s time in office. The Coolidge years took place during the Roaring 20s which saw stocks go from insanely low valuations to insanely high valuations just before the onset of the Great Depression.
Clinton’s two terms saw markets go from above-average valuations to the highest valuations in history. George W. Bush was in office as those valuations were worked off while Obama timed the lows pretty closely for the start of the next bull market.
Since Trump took over 4 years ago the S&P 500 is up more than 55% in total (12.4% annualized). In that time the CAPE ratio has gone from 28.1x to 31.6x the trailing 10 years’ worth of earnings. The relatively small increase in valuation tells us fundamentals have kept up for the most part. This may surprise some people who assume all of the gains are a mirage.
Whoever wins the election will be dealing with high starting valuations and low interest rates.
Not only will they start out with the second-highest starting CAPE ratio ever for a president, but they will also be dealing with by far the lowest interest rates in the 140 or so year history of this data. No matter who wins or what policies they implement, this is going to be one of the most challenging market environments to start a presidential term in history.
Stock market valuations can always go higher (especially in light of where interest rates stand) but investors should temper their expectations regardless of the winner.
The market is bigger than any person or office. It will do what it’s going to do no matter who lives in the White House.
Try to remember this when people try to credit or blame the market’s performance on the president over the next 4 years.
Further Reading:
Don’t Mix Politics With Your Portfolio

