Back in March during the height of the stock market sell-off, I wrote about how long it has taken historically to make your money back following a bear market:
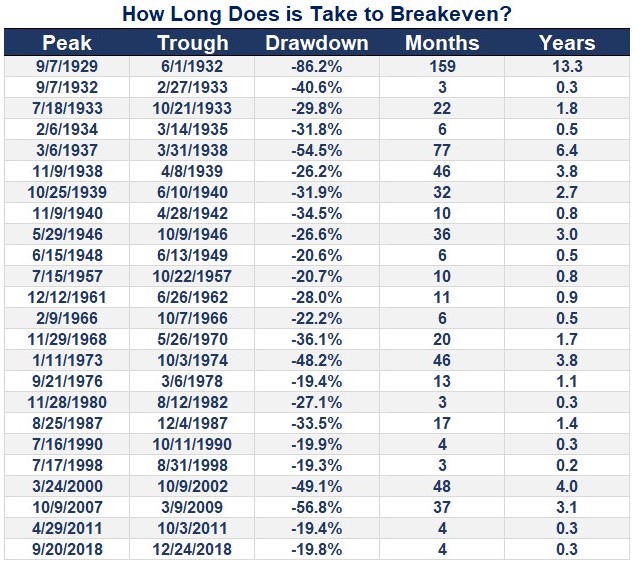
The average breakeven to make a round trip from peak-to-trough-back-to-peak has been around 26 months.
The fastest breakeven going back to the 1920s for a bear market of 30% or worse was in 1932-1933 when it took just 3 months for a full roundtrip. The breakeven for the current bear market happened in just under 6 months, making it the second-fastest on record:
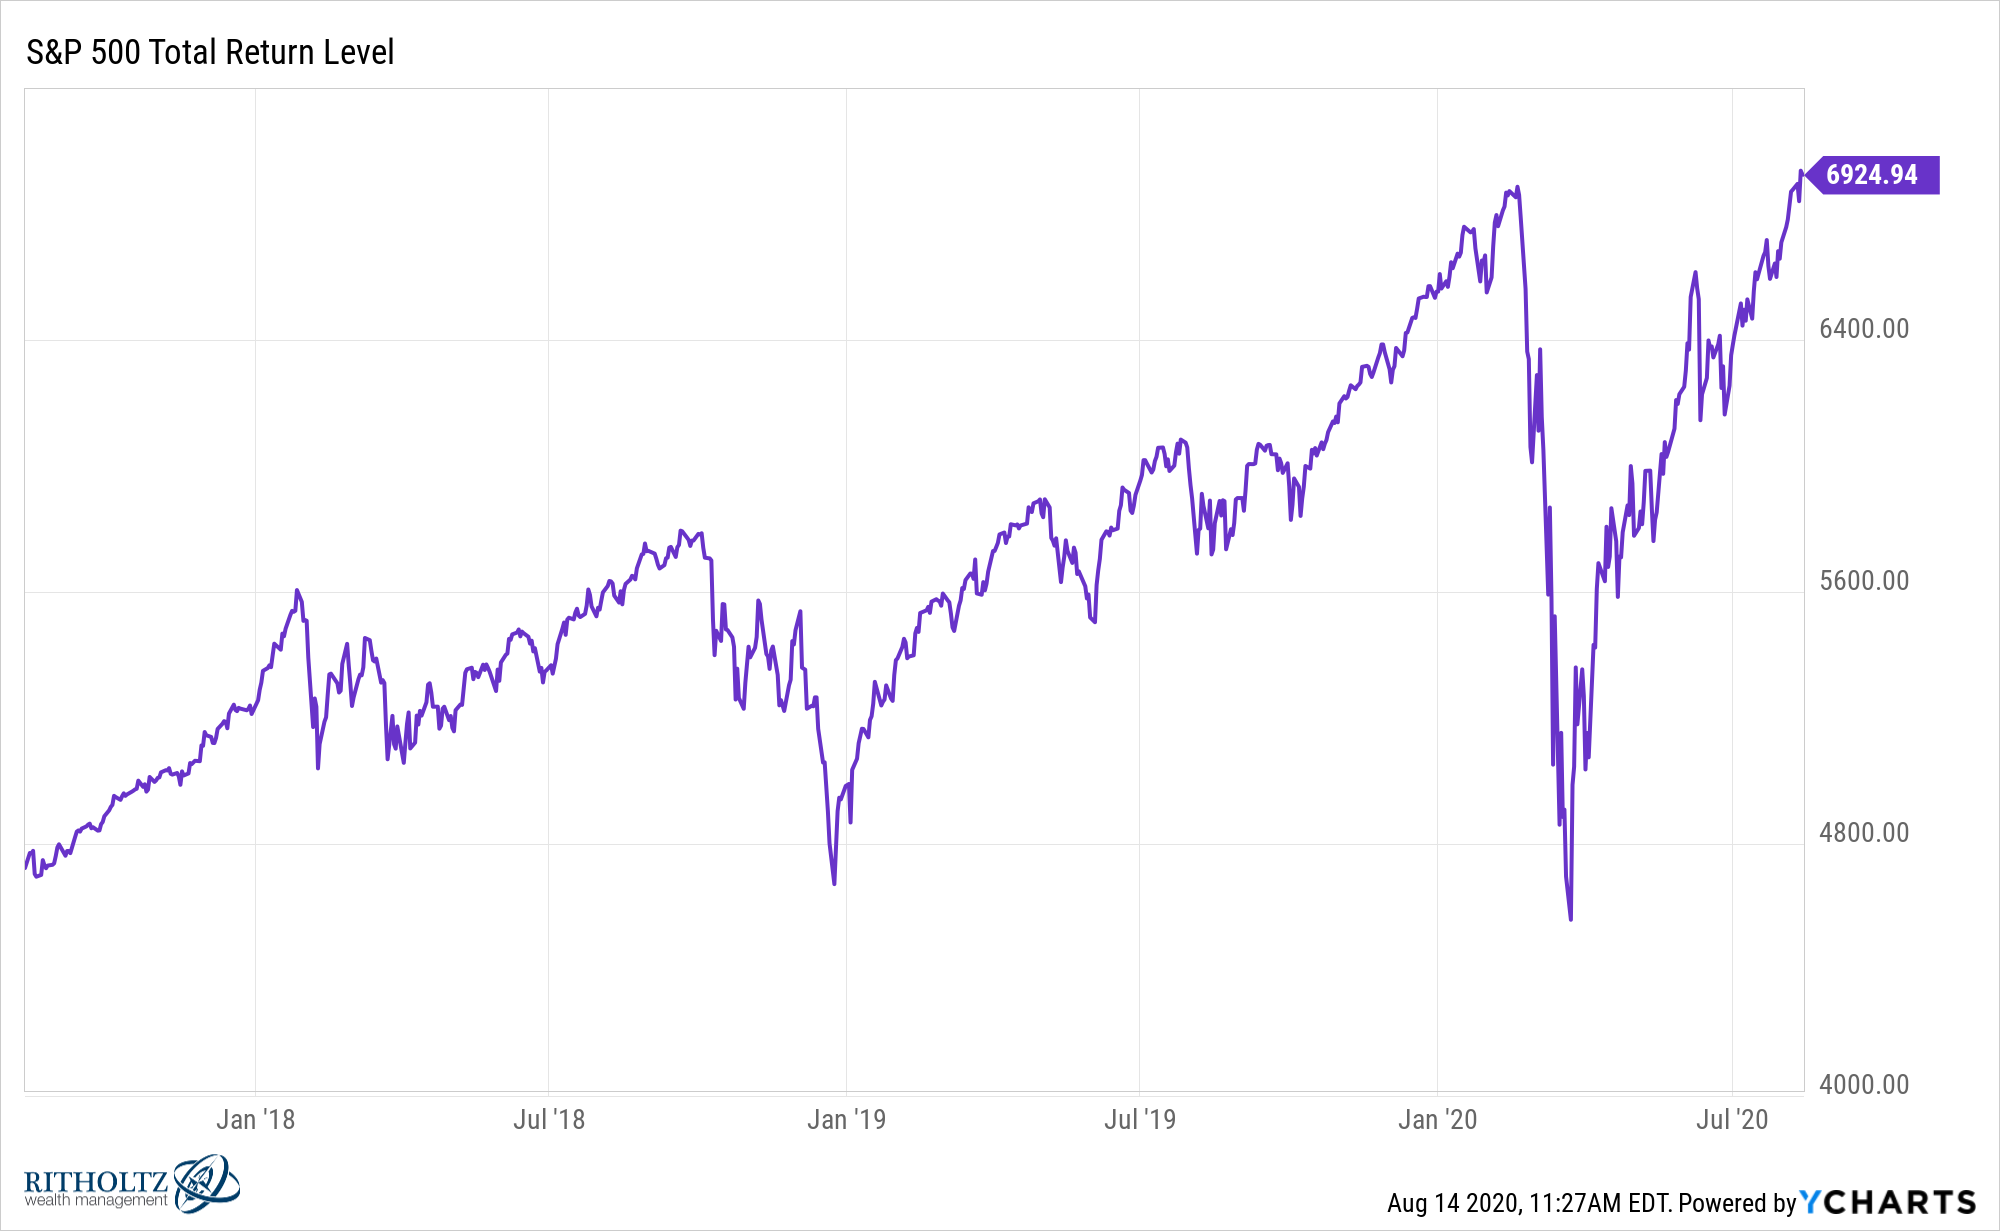
After peaking in late-February, the S&P 500 reached a new high this week when you include dividends.1
So we just experienced the fastest 30% bear market from all-time highs in history along with the second-fastest recovery from a 30% bear market in history.
The market lost roughly 34% from late-February through late-March and then proceeded to gain more than 52% to make it all back. It took just 23 trading days on the way down and 97 on the way back up.
The V-shape of the market this year is staggering, especially since it occurred during a global pandemic that the United States still doesn’t have under control.
Volatility in the stock market is nothing new but the speed of both the decline and the recovery is enough to make your head spin.
A similar V-shaped recovery took place after the correction in late-2018:
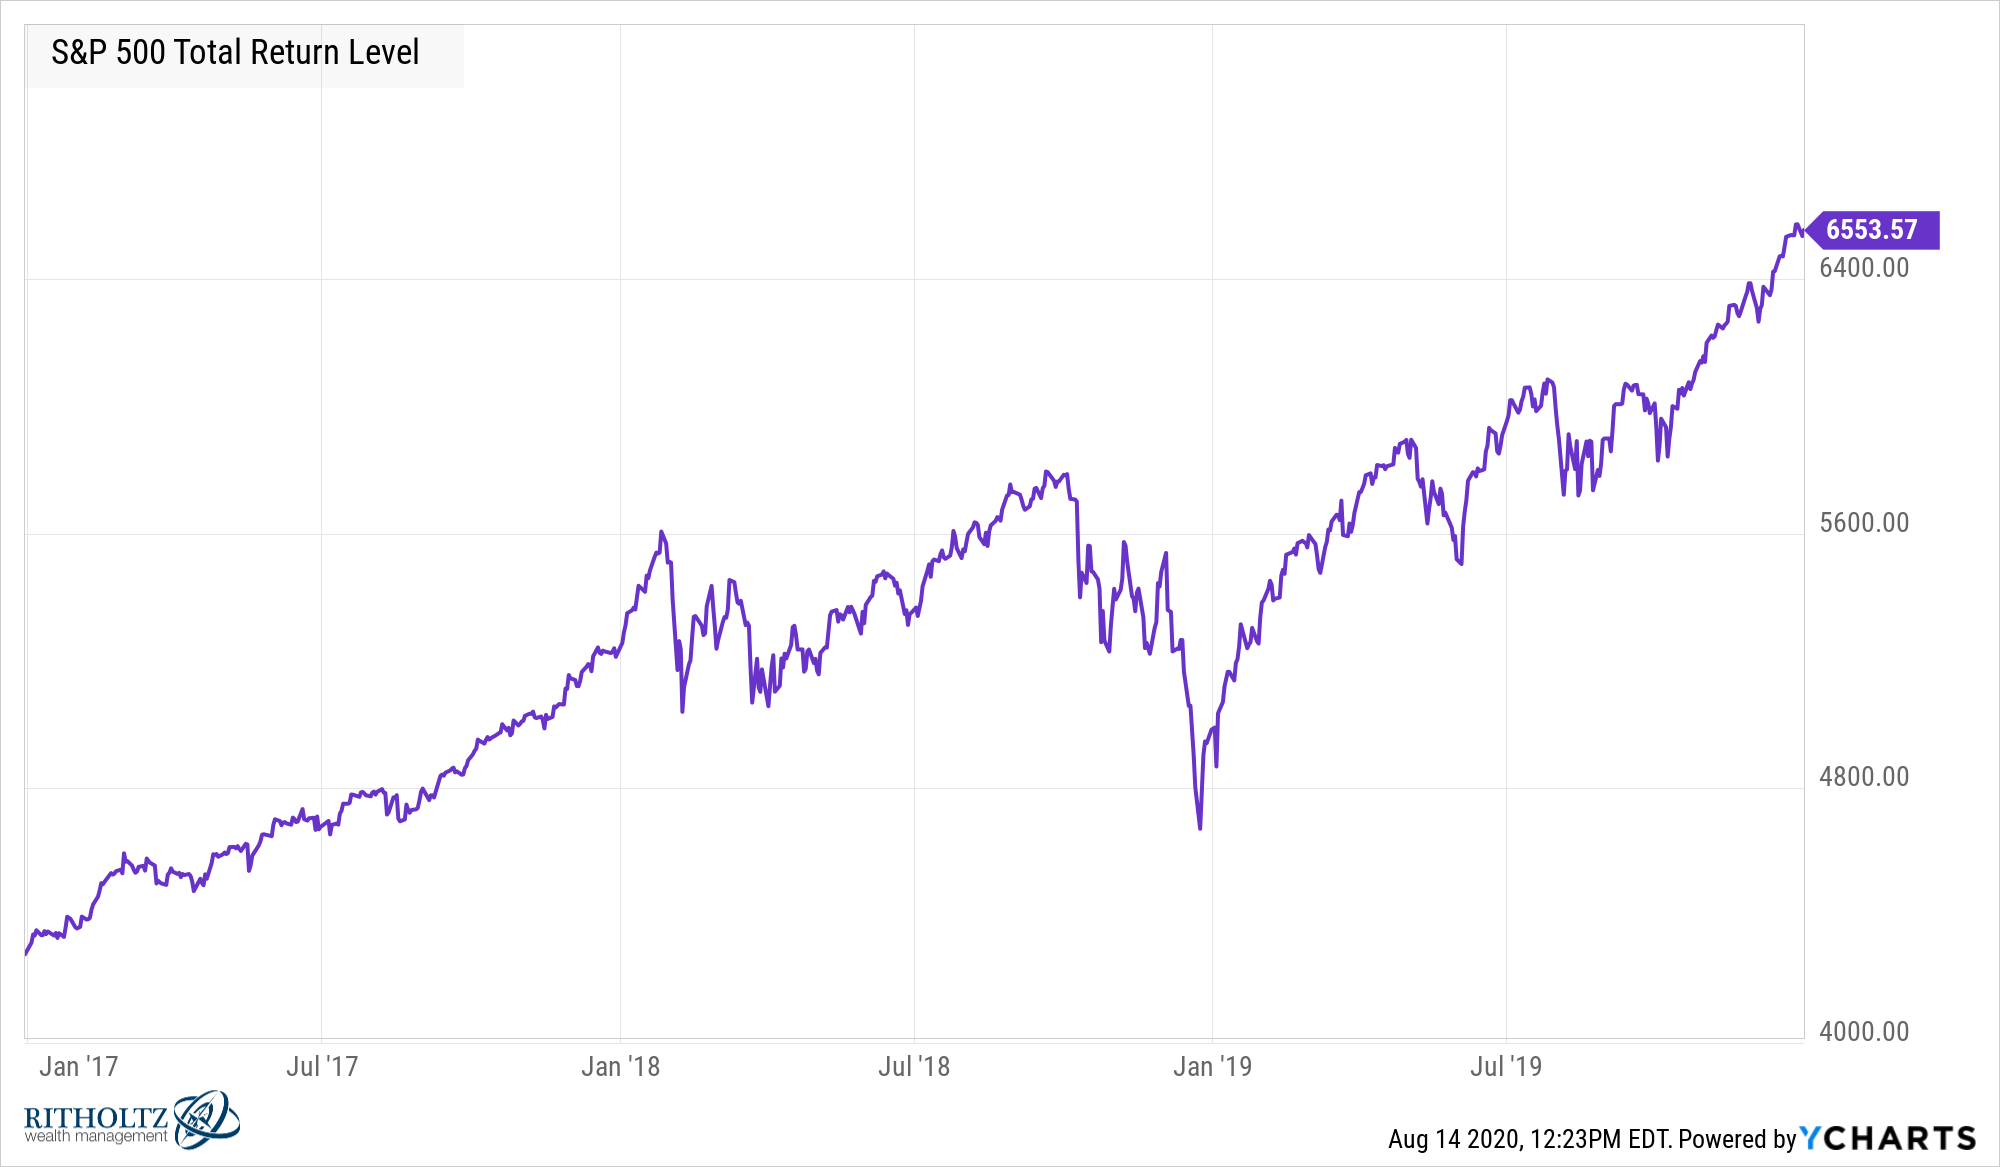
The S&P 500 fell nearly 20% from late-September through Christmas Eve of 2018. It then took just 4 months to make those losses back.
There’s an argument to be made that market cycles like this will only continue to happen at a breakneck pace in the future.
The Great Depression stock market crash technically lasted 4 years or so but the effects from that downturn lasted a generation. On a price basis, the stock market didn’t reach the 1929 highs until the 1950s. On a total return basis, it took nearly a decade-and-a-half.
If this pandemic and economic shutdown would have occurred prior to the 2008 crisis, I’m guessing the stock market would have fallen a minimum of 50% to 60%.
The Great Recession planted the seed for a larger, faster response from the Fed and other government officials. This situation has certainly benefited from what we learned during 2008. The Fed becomes more intertwined with the markets with every passing crisis and it’s going to be next to impossible to retract their tentacles from the functioning of the financial system.
We also have technology speeding up the flow of information and breaking down the barriers to entry in the markets.
There are still many investors who don’t understand the nature of the markets has likely changed for the foreseeable future.
“I’ve seen this movie before and…” No you haven’t. Not like this.
Human nature remains the one constant as always but the combination of technology and government intervention means the response may not be what it once was.
Investors are now trained to buy when markets fall because they “always” come back.
It will probably take an extended bear market with multiple legs down to break the will of investors to change this line of thinking.
And I’m not saying we’ve outlawed market crashes. I actually think they’ll be more frequent going forward, just smaller & shorter than they would’ve been in the past.
Maybe I’m wrong. Maybe there will a new Fed chair that screws things up. Maybe there will be a crisis where we get hit from 10 different angles.
But it feels to me like things are going to be sped up for some time from crashes to central bank response time to market recoveries.
Further Reading:
How Long Does It Take to Make Your Money Back After a Bear Market
1On a price basis it’s still a few points short but close enough. The S&P 500 closed at 3,386.15 on February 19. On Friday, it closed at 3.372.85. Close enough.

