From 1928-2019, the S&P 500 was down in 26 out of 92 years.
That means returns were positive 72% of the time and negative 28% of the time.
These historical probabilities can be helpful to understand that the stock market rises most of the time but not all the time. The fact that the market has risen roughly 3 out of every 4 years, on average, is nice to have in the back of your mind when investing for the long-term but “on average” can be misleading in the markets.
It seems almost impossible given the state of the world right now but the S&P 500 is now up close to 8% on the year as of this writing.
The year is far from over and considering we’ve already had the equivalent of 3 different market cycles over the past 8 months anything is possible from here on out.
But as of right now the S&P 500 has seen positive returns in 11 out of the past 12 calendar years (if we include 2020) and 16 out of the past 18 years:
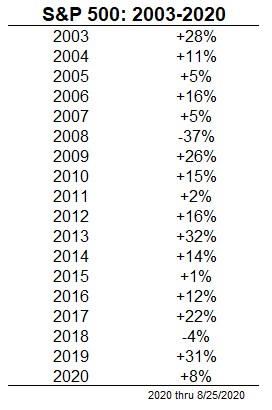
Even with 2008 and this year’s turmoil, this is an unbelievable run.
Obviously, it hasn’t always been easy:
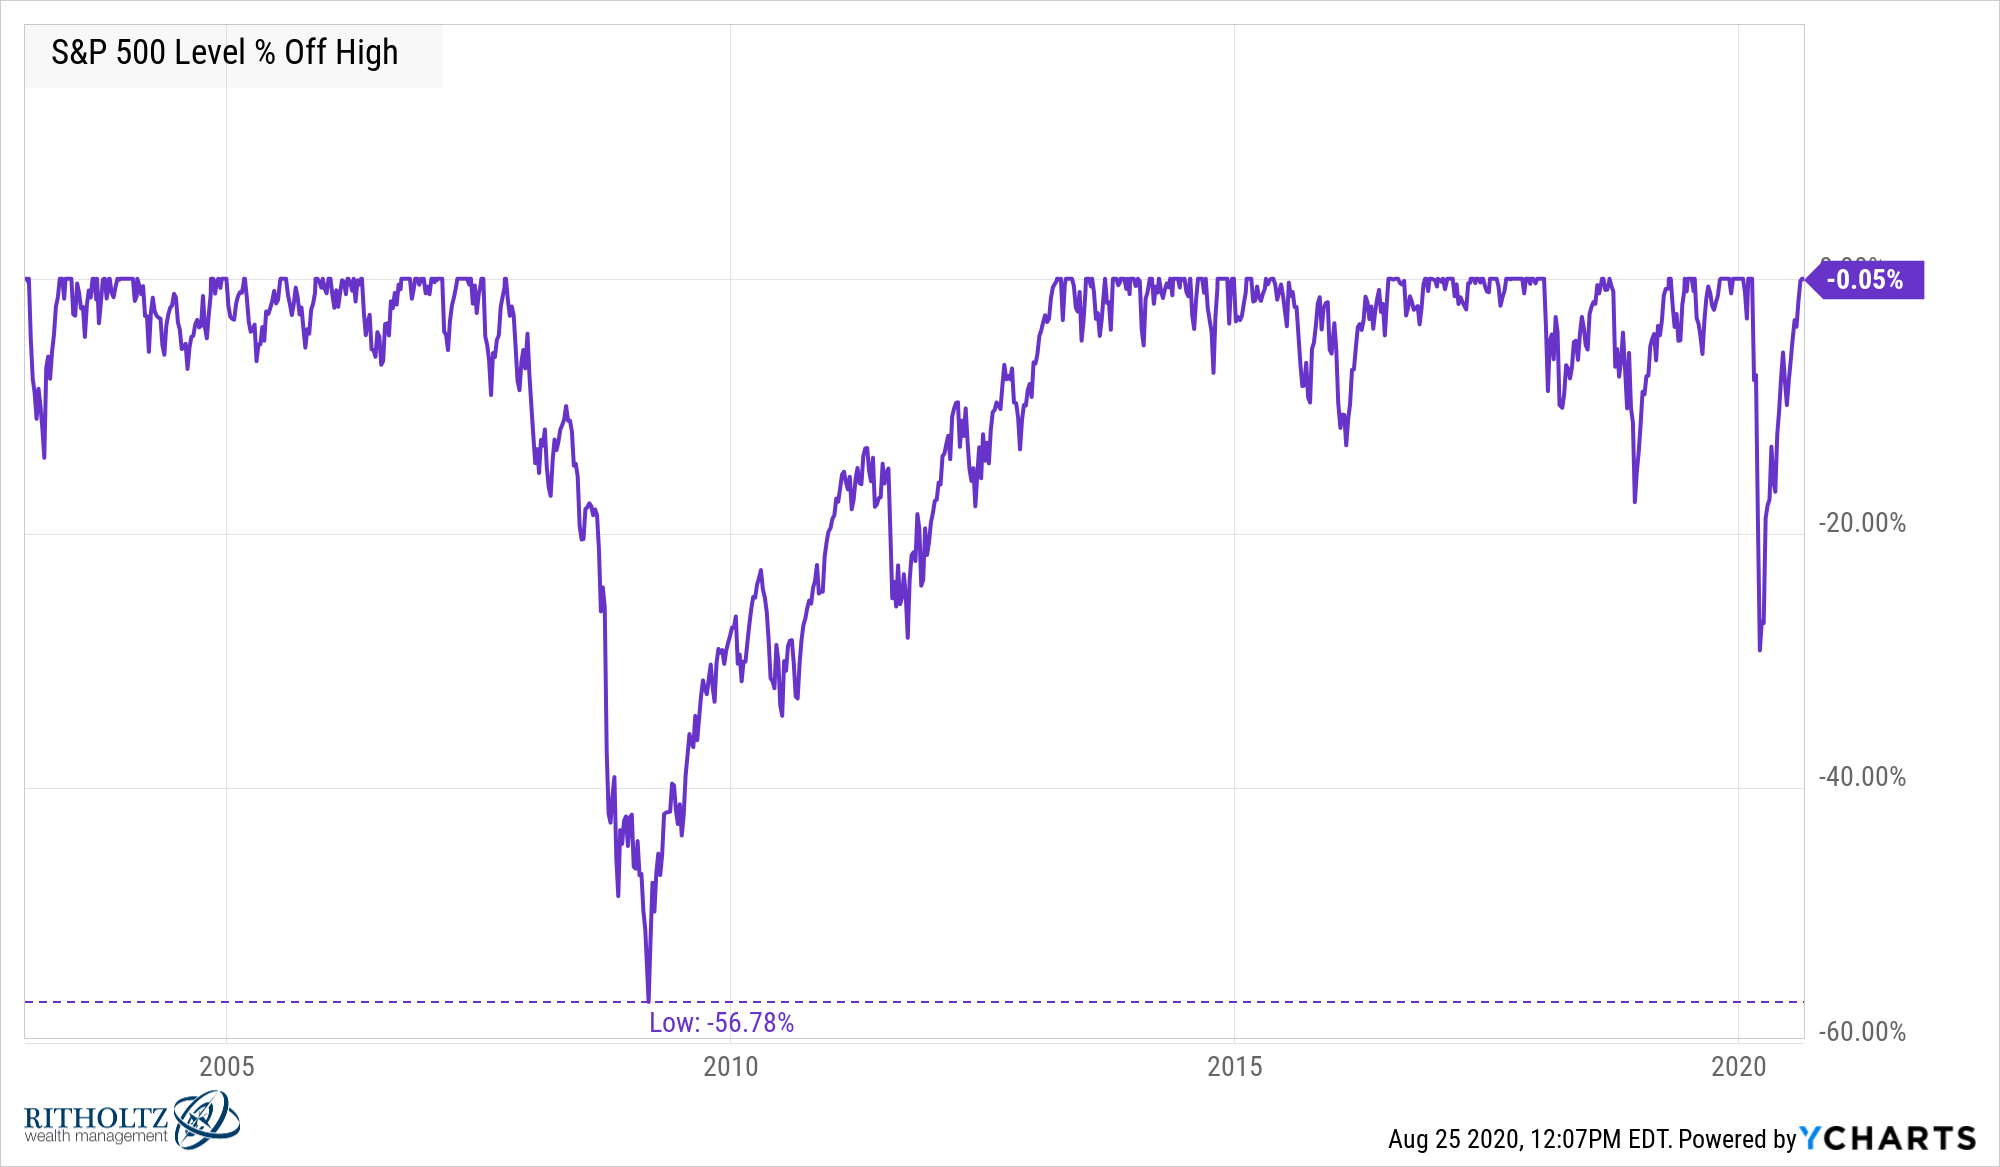
There is nothing special about calendar years other than the fact that it’s the amount of time it takes our planet to revolve around a huge ball of fire that’s 93 million miles away. Still, most people who don’t follow the market closely would be shocked by these numbers.
This may be the second most impressive run in the past 100 years or so given its longevity. The crown still belongs to the 1982-1999 time frame which saw the S&P higher in 17 out of 18 years with the only down year a loss of 3% in 1990. And the drawdowns were far more muted in that period:
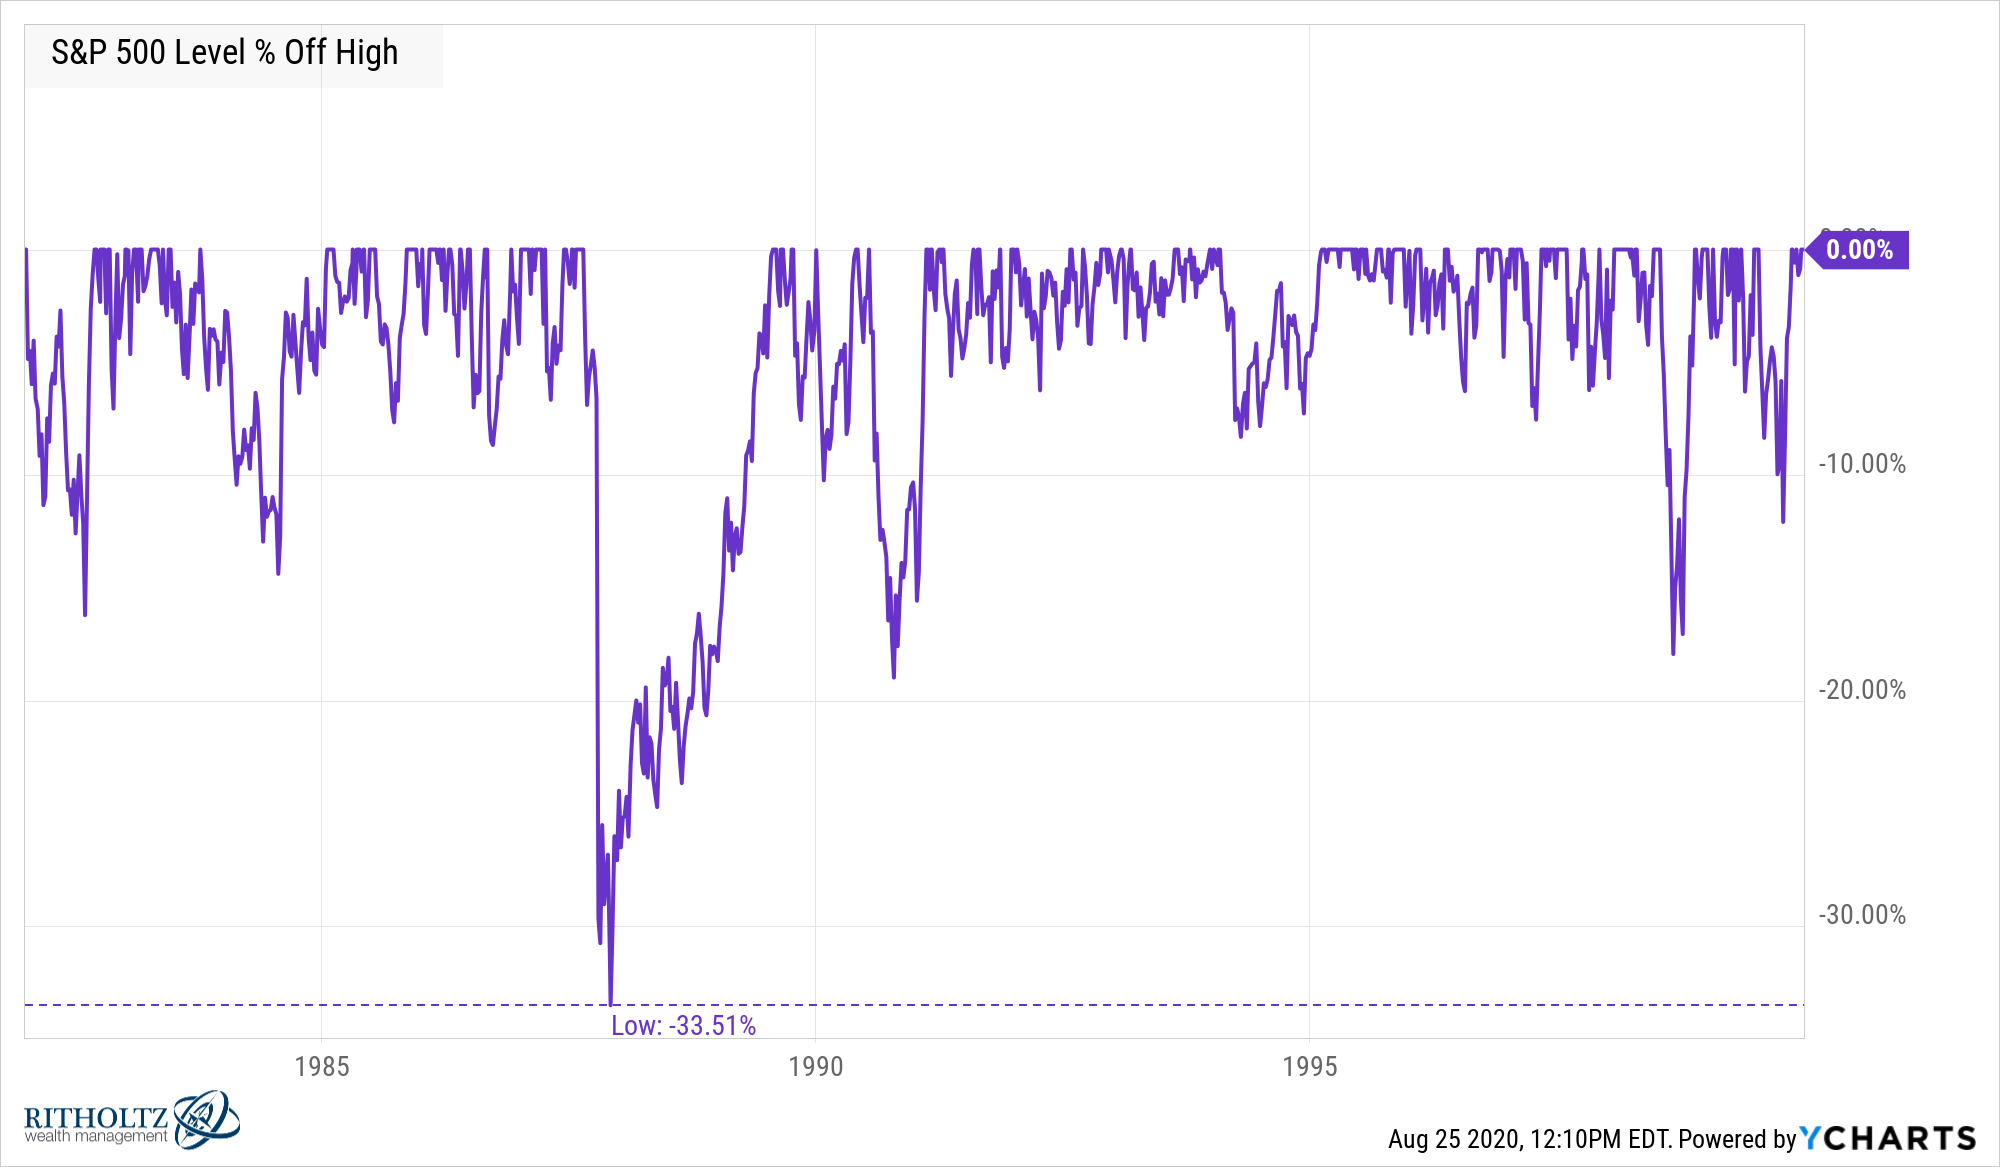
Never say never but it’s hard to see that run of returns ever duplicated.
Then there is the 1929-1946 period when the S&P fell in 10 out of 18 years with an average down year of -16%. This awful period was followed by the relative calm of 1947-1964 when the market went on a run 15 out of 18 years with positive returns.
It’s also worth pointing out what happened in the aftermath of the wonderful runs of performance from 1947-1964 and 1982-1999.
From 1965-1981, the stock market did decent on a nominal basis, up 184% or 6% per year. But after factoring in inflation, the stock market was down 3% in total for this 17 year period.
And following the greatest U.S. bull market of all time from 1982-1999, the S&P 500 experienced a lost decade from 2000-2009, with losses totaling 9% for the entirety of the aughts.
I’m not saying we’re overdue for a prolonged period of losses in the years ahead. The stock market does not run on a schedule.
But it is streaky.
The most consecutive up years for the S&P 500 is 9 in a row, which happened both from 1991-1999 and 2009-2017.
The most consecutive down years came during the Great Depression when the market fell in 4 straight years from 1929-1932. It was also down for 3 straight years from 1939-1941 and 2000-2002.
The good periods can last longer than most investors can possibly imagine but the hangovers can be severe on the other side of it. No one experiences the market “on average” because long-term averages obscure the fact that the range of results in any given cycle varies widely.
Risk and return in the stock market are not evenly distributed.
Further Reading:
Explaining the Stock Market to Big Cat

