The consensus from economists for this week’s employment report was a payroll decline of 7.5 million employees, which would translate into an unemployment rate of 19.1%.
Based on everything we’re hearing and seeing in the economy and economic data throughout the pandemic, this seemed like a decent estimate of what was to come.
To quote the legendary Bob Uecker, this estimate was:
https://www.youtube.com/watch?v=Jdv2Wp9MzY0
These were the actual numbers (graph from the NY Times):
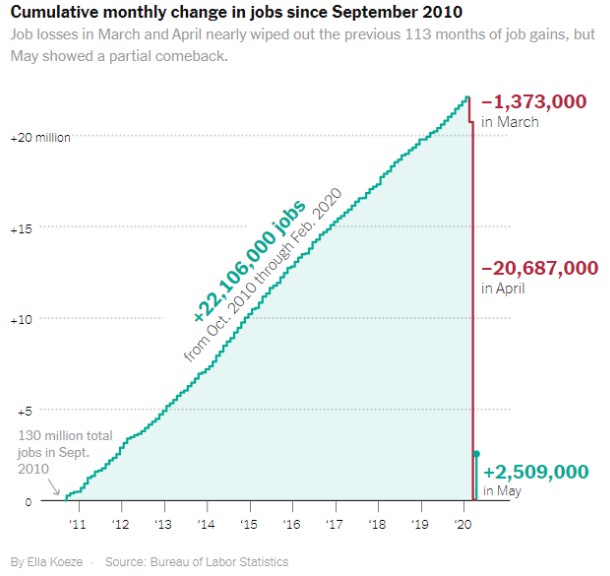
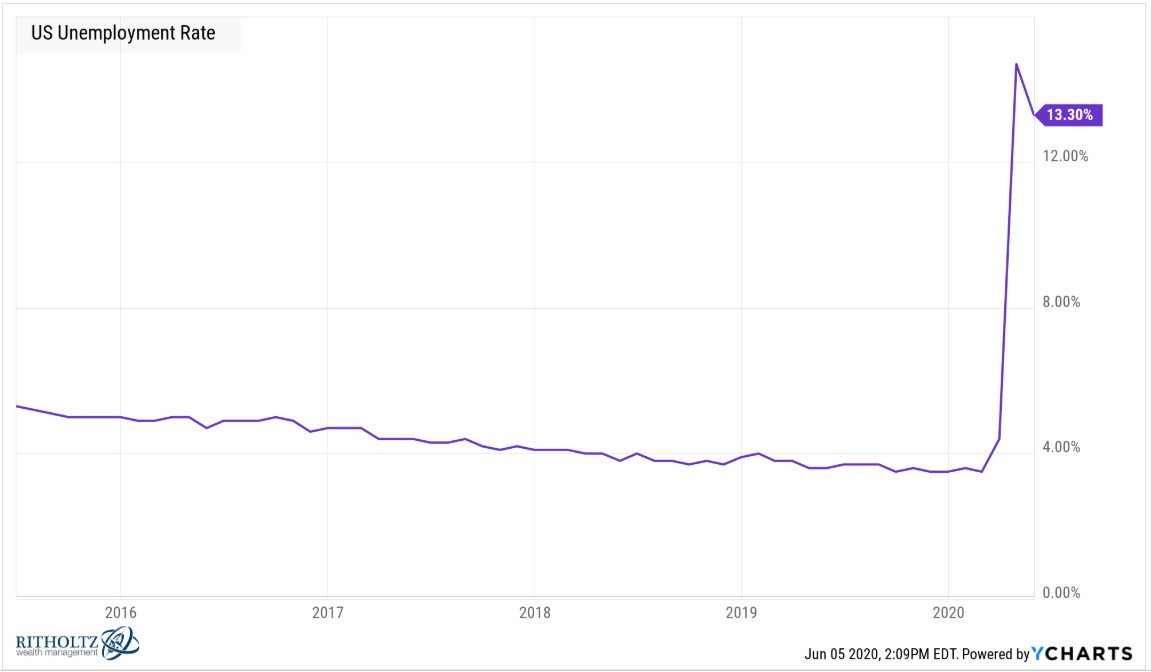
Instead of 7.5 million jobs lost in May, there were 2.5 million jobs added. And the unemployment rate didn’t scream higher to 19.1%, it actually fell to 13.3%:
It would be easy to take shots at the experts on this one but literally NO ONE saw this coming. I don’t blame people for being wrong about economic and market stuff this year because this is one of the craziest economic and investing environments in history.
The unemployment rate went from the lowest level in 70 years at 3.5% in February to 4.4% in March to 14.7% in April to 13.3% in May.
Long-term economic charts are broken for history from these bizarre past few months but there have been other charts that stick out as well. Here are some of the craziest charts of the year (so far):
The US Global Jets ETF (JETS) has to be in the running for ETF of the year at this point strictly from the increase in AUM alone:
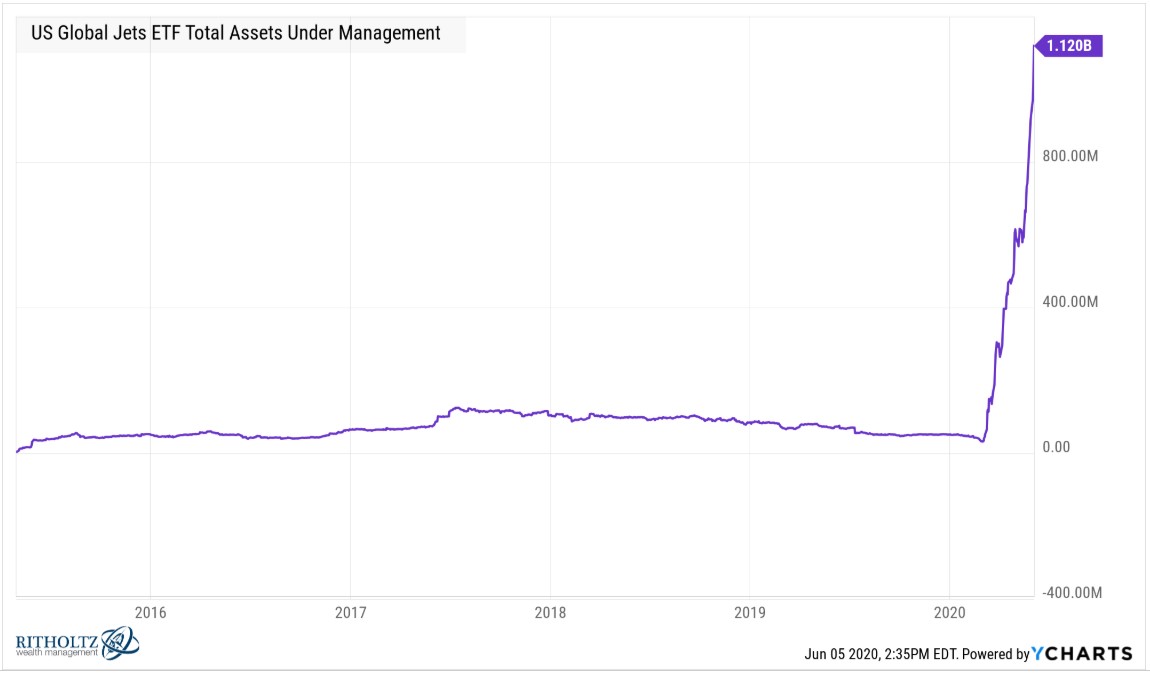
As of the beginning of March 2020 there was less than $35 million in this ETF that tracks the airline industry. Just 3 short months later this thing now has well over a billion dollars in assets, which seemingly rises every single day.
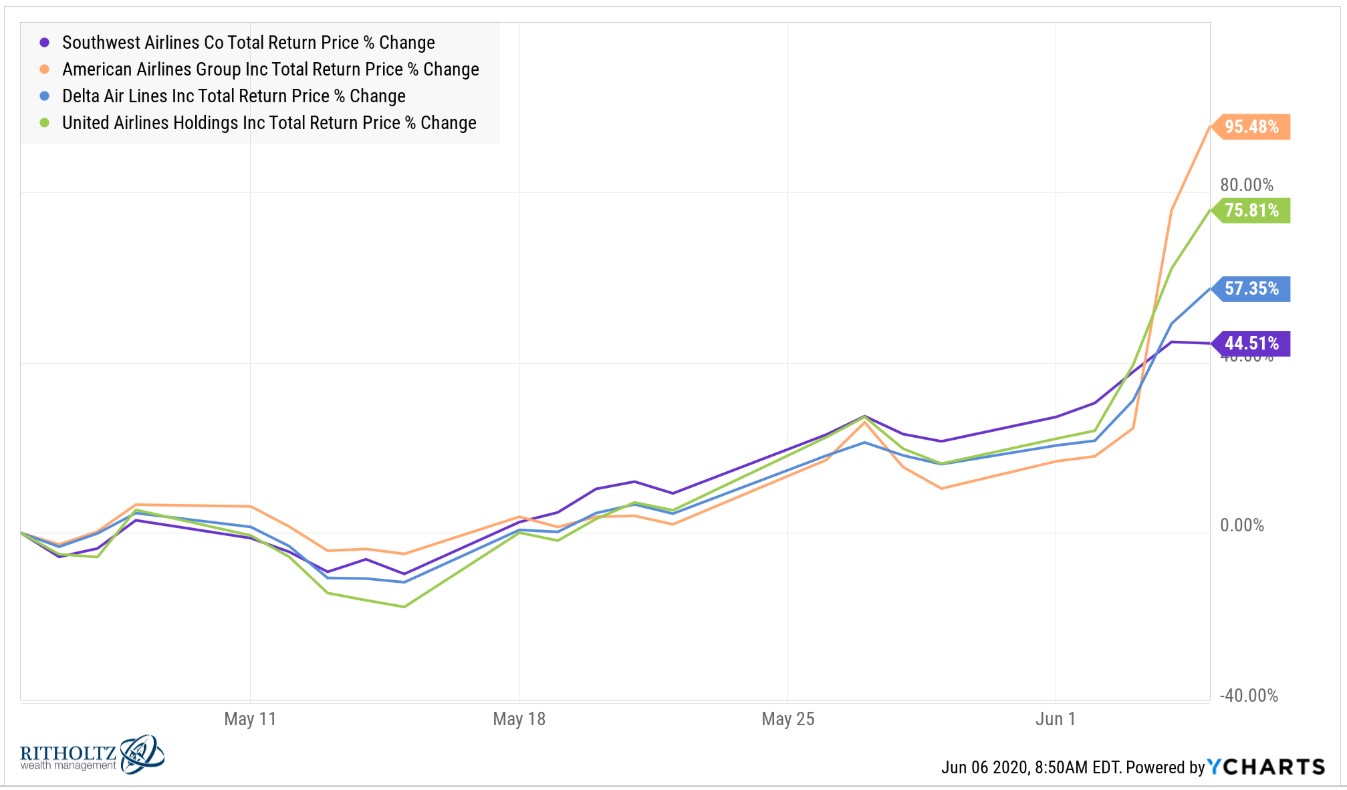
This is the performance of some of the biggest airlines over the past month:
The V in the Nasdaq 100 ETF (QQQ) is a sight to behold:
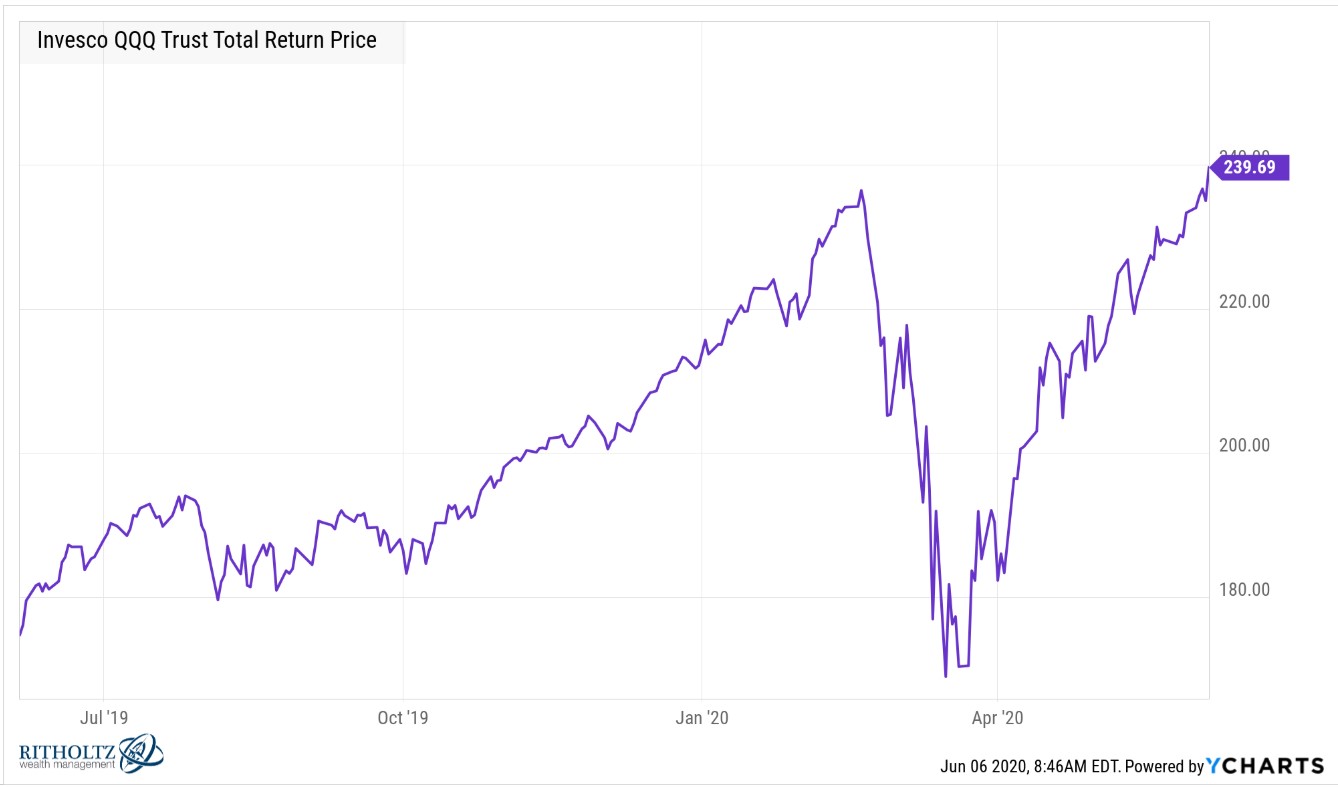
After falling 29% this index has now safely surpassed its all-time highs from late-February.
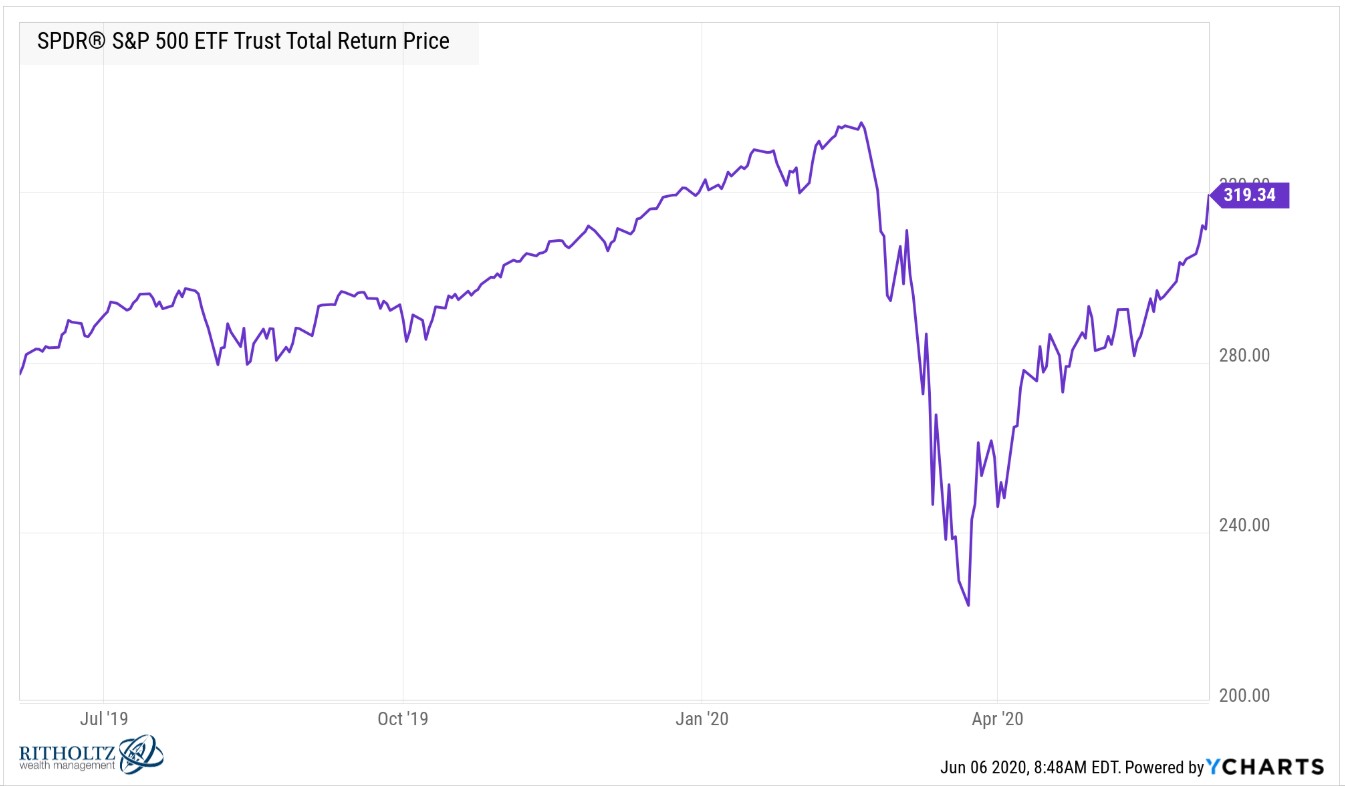
The S&P 500 is closing in on new highs as well:
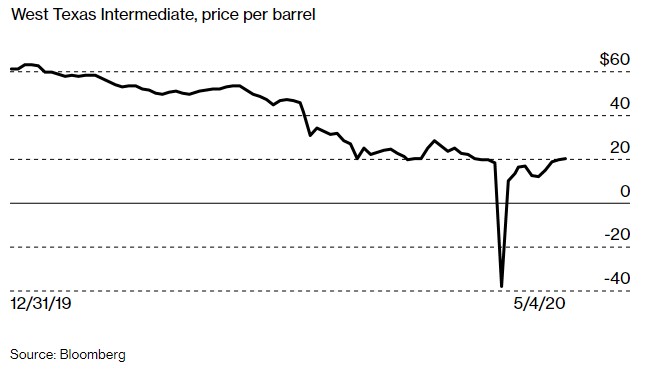
Oil prices going negative feels like something happened 8 years ago:
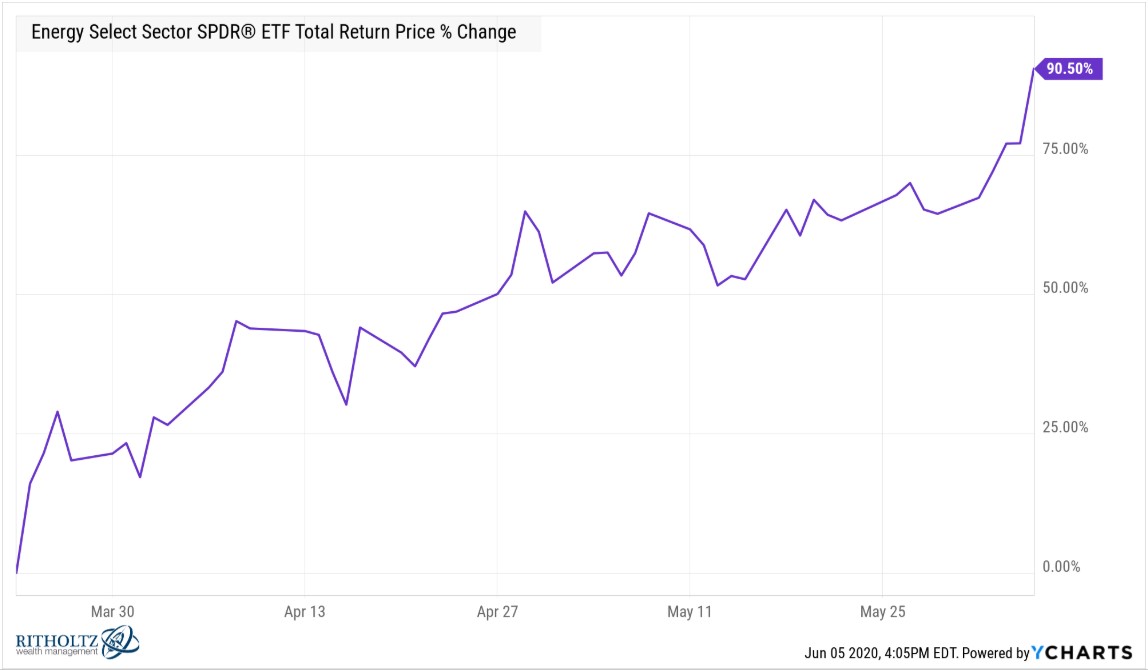
Somehow commodities markets took this in stride. Energy stocks as a group are now 90% off the lows yet still remain down almost 25% on the year:
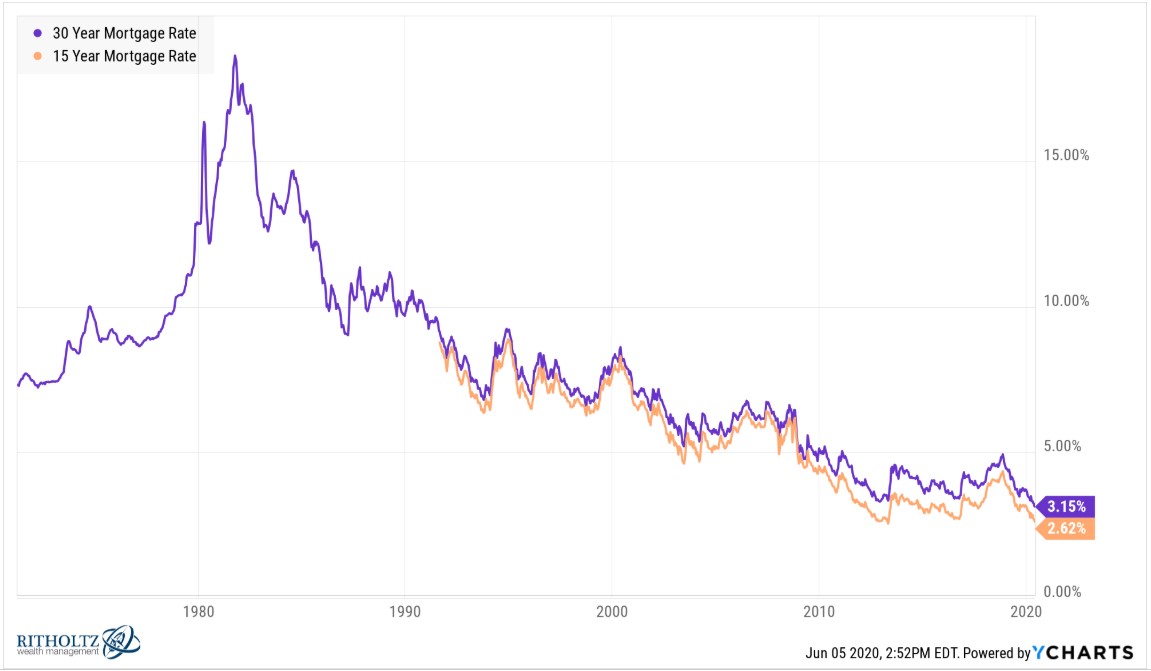
30-year and 15-year fixed-rate mortgages both his new all-time lows in recent weeks:
The stock market is much sexier than the bond market so not too many people pay attention to the municipal and corporate bonds but the drawdowns in these segments of the market were about as bad as they are going to get in such a short period of time:
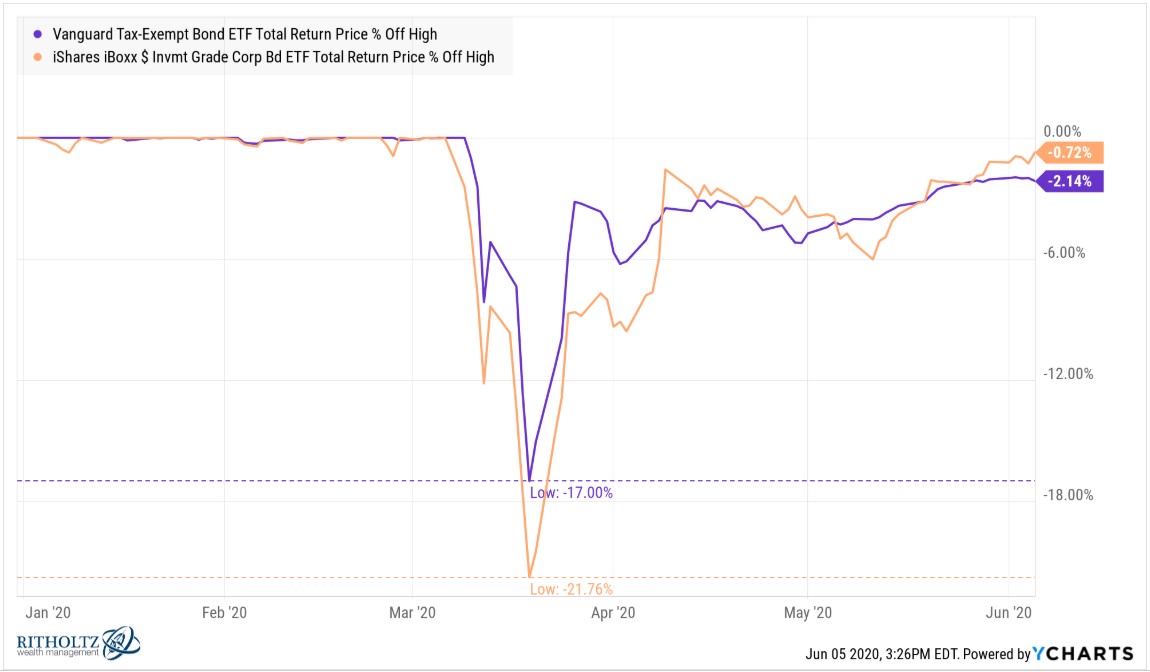
Those are decent drawdowns for relatively high-quality bonds. After the Fed stepped in to calm the credit markets they recovered fairly quickly. Both funds now have positive gains on the year.
I’m sure I missed plenty of candidates for crazy charts of the year so feel free to send me any that I missed.
*******
Michael and I talk about airline stocks, euphoric behavior by some investors and how to teach your kids about investing in this week’s Animal Spirits video:

