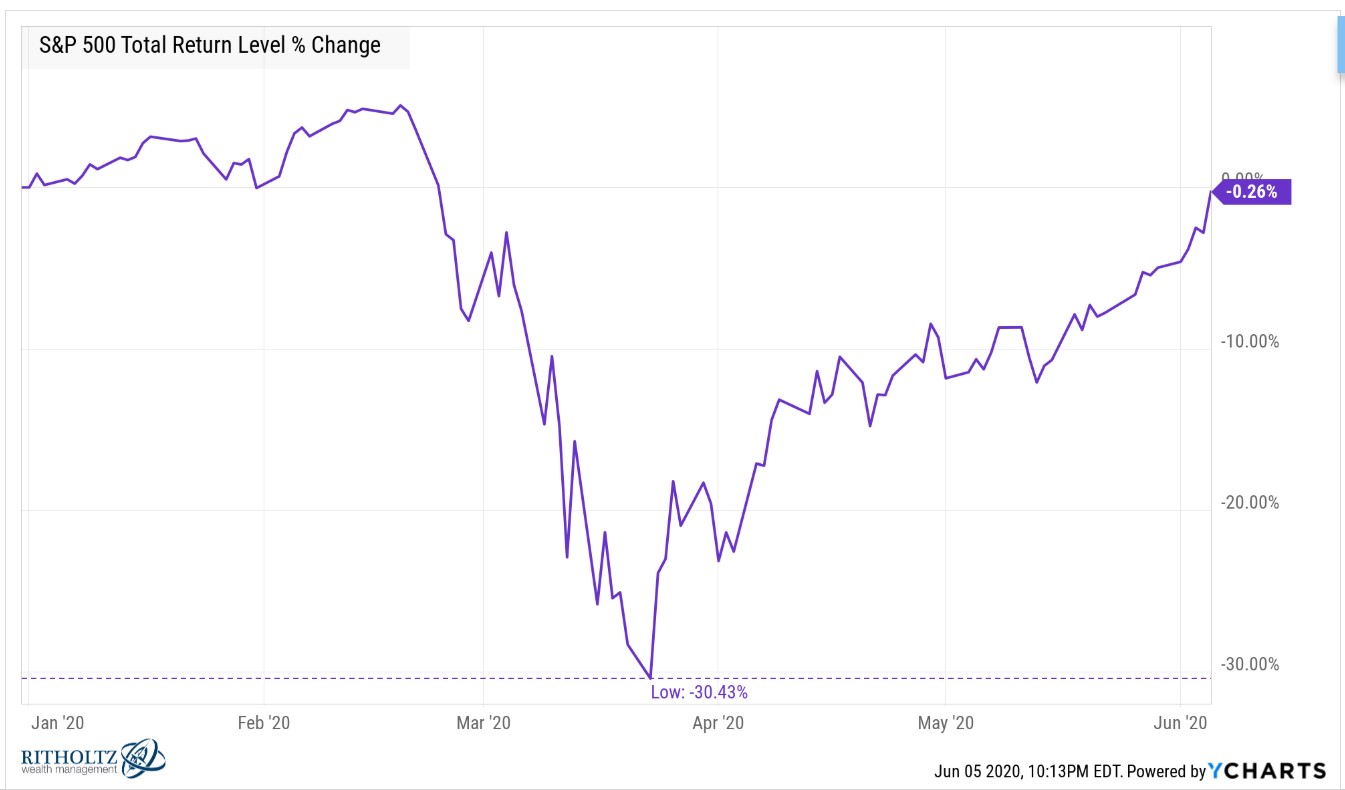
After Friday’s big rally on better-than-expected jobs numbers, the S&P 500 is now more or less flat on the year.
Considering the year-to-date return as of the close on March 23rd was -30.4%, this is quite a turn of events.
From the lows, the market is up more than 43%.
It’s cherry-picking to show returns from the low point of a bear market but the difference between where we were and where we are is staggering.
As of March 23, the S&P 500 from a total return basis was 33.8% off all-time highs.
As of this past Friday, the S&P 500 from a total return basis was 5.1% off all-time highs.
To get back to all-time highs from March 23rd levels, the S&P 500 needed to rise 51%.
To get back to all-time highs from this past Friday’s levels, the S&P 500 needs to rise 6%.
The 5-year annual return for the S&P 500 on March 23rd was +3.3%.
The 5-year annual return for the S&P 500 through this past Friday was +11.1%.
The 10-year annual return for the S&P 500 on March 23rd was +9.0%.
The 10-year annual return for the S&P 500 through this past Friday was +13.9%.
The annualized daily volatility of the stock market this year is close to 50%. For comparison purposes, the standard deviation of daily returns in 2019 and 2018 were 12% and 17%, respectively.
There have been 35 daily gains or losses of 3% or more this year. Over the past 5 years, there have been just 11 moves of 3% or more in total. Just one of those 11 big moves over the past 5 years was a loss in excess of 4% (it was -4.1%).
There have been 6 losses of 4% or worse in 2020 and 4 of those were worse than 5%. There wasn’t a single daily gain of 4% or more from 2015-2019. This year there have been 8 such moves including 5 days with gains of 6% or greater.
Your experience in the stock market is likely colored not only by the market’s moves but also by the moves you have or haven’t made in your portfolio.
I’m sure there are people who sat through the initial losses, only to capitulate in March and sell in hopes of redeploying at lower levels. Others may have lucked out and put a big slug of cash to work near the bottom.
That first investor is angry at the market gods while the second one is ecstatic.
Then there is the boring dollar cost averaging investor who dutifully put money to work on a set schedule. Dollar cost averaging is essentially how you diversify your purchases across time. This isn’t necessarily a market-timing system but a necessity for most investors because they save when they get paid.
Let’s say you get paid every Friday and throw one-hundred bucks into an S&P 500 index fund or ETF automatically on payday. Here are the total returns you would have seen from this simple system from the end of each week:
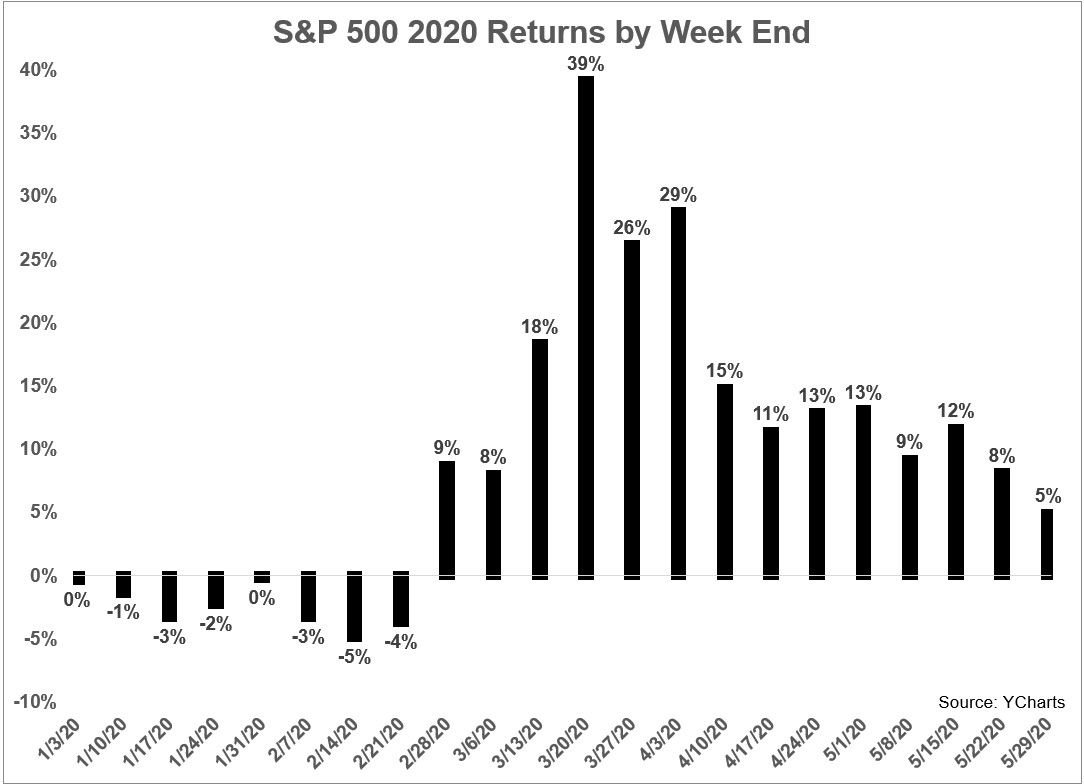
Considering the year-to-date returns for the S&P are roughly 0%, these performance figures are all over the map.
In this example, you would have contributed $2,200 to your portfolio1 so far throughout 2020. Because you invested at different points throughout the year, many of your purchases occurred when the market was down much more than it is now.
How has it worked out?
That $2,200 in contributions has grown to nearly $2,400. That’s not an enormous increase but it’s a gain of roughly 9% on your money versus no gain in the S&P from the start of the year.
Granted, this is a short-term example in a wild market environment. But this shows the benefits of continuing to invest during violent market moves.
Some purchases are still underwater. Others have enormous gains in a short period of time.
This is not always the case, but 2020 is a case study in the power of simplicity when it comes to portfolio management and investment decisions.
Dollar cost averaging doesn’t always work so neatly but it’s beat the pants off the majority of timing strategies and macro predictions this year.
If you’re a buy and hold investor you’ve been on a rollercoaster ride with your emotions and your money. Things didn’t have to unfold this way but simply sitting on your hands would have saved you from making a grievous error by selling out when stocks were down.
There’s nothing special about averaging into the market or buy and hold but these strategies don’t require you to guess the direction of the market, predict interest rate levels, read the Fed’s beige book, pore-over company financial statements or quote the stoics in your quarterly letters to investors.
Every strategy has drawbacks. Buy and hold requires intestinal fortitude by eating painful losses and the ability to do nothing most of the time. This is easier said than done for many investors.
Despite the drawbacks, at least it’s a plan.
Reading the tea leaves, waiting for the dust to settle or guessing where the stock market goes next in the short-term is not a plan.
The market doesn’t care about your investment plan but if you don’t have one these crazy moves are even harder to deal with.
Further Reading:
When Dollar Cost Averaging Matters the Most
1I’m not including the contribution from this past Friday.

