In March I wrote about what has happened historically to forward stock market returns following the worst down months in stock market history:
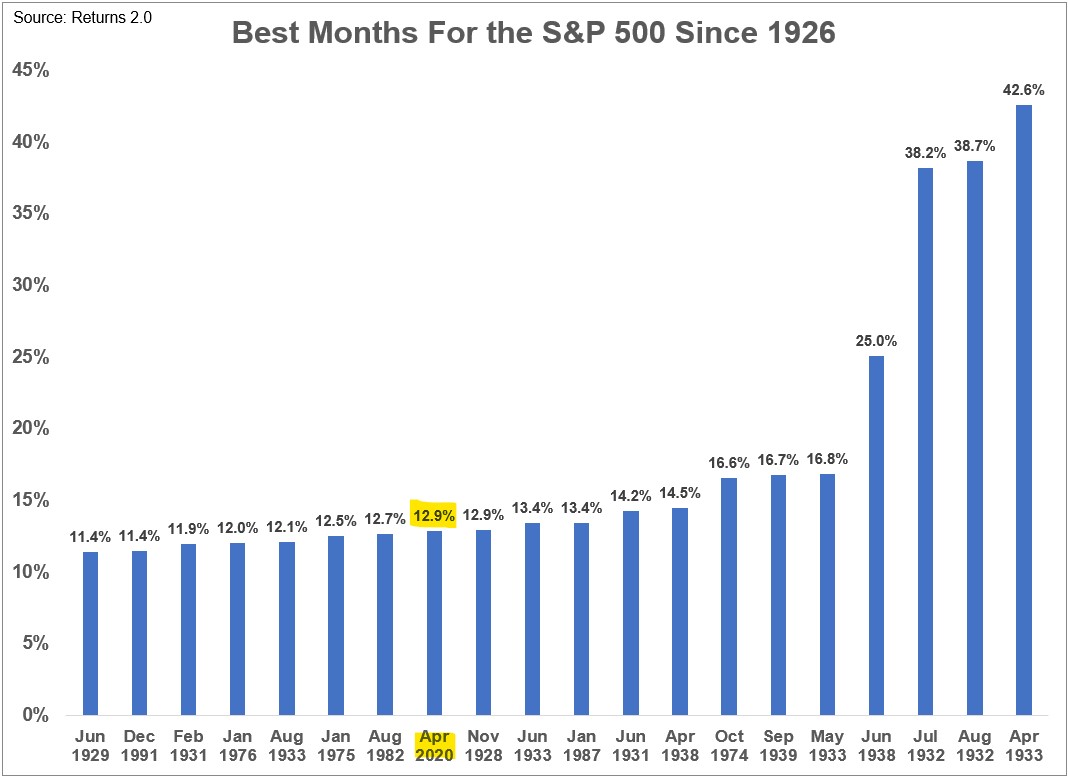
Still a little early to circle back on the results but April gave us the chance to look back at the other side of this coin. April was one of the best months ever for the S&P 500:
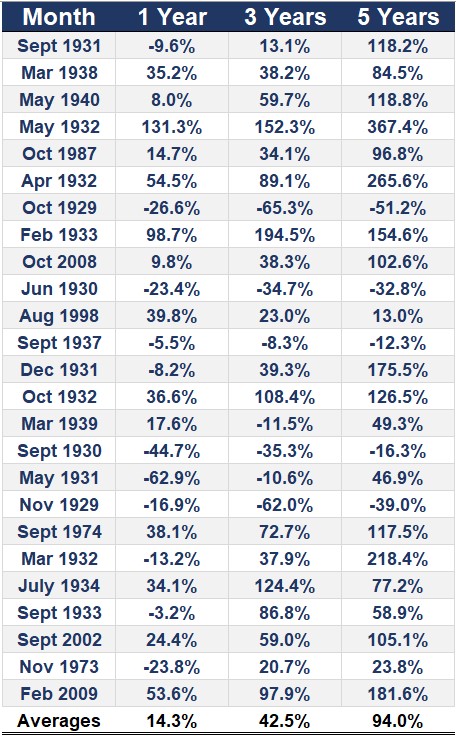
Here’s what happened next in the one, three and five years following these huge up months of the past:
The averages look pretty decent as well as the ratio of positive to negative results. Following the biggest up months in history, the S&P 500 was positive nearly 60% of the time one year later, almost 75% of the time 3 years later and just shy of 90% of the time 5 years later.
That’s pretty good considering the average return was close to 70% in total five years out.
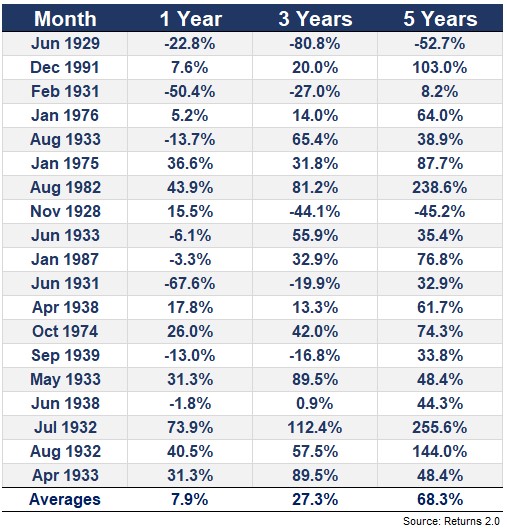
Of course, averages tell us nothing about the range of results which is quite wide here, especially in that nasty 1930s timeframe.
Check out the averages of the returns for the S&P 500 following big up months exclusively in the 1920s and 1930s:
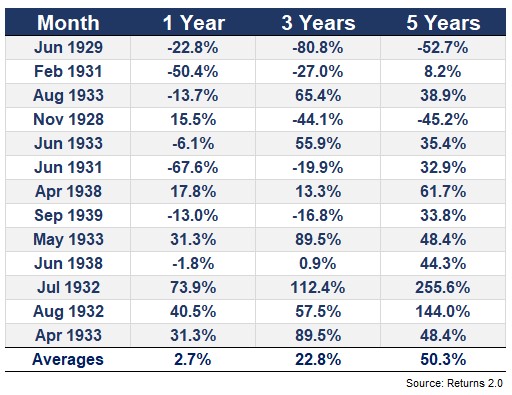
It’s crazy to think 13 out of the 20 biggest up months occurred just before, during or in the aftermath of the Great Depression. As volatile as things have been in the markets over the past 3 months or so, they were like that for more than a decade back then.
It’s almost hard to believe markets as we know them survived that period.
In this group, less than half of all one year periods saw positive returns a year later and 5 out of the 7 negative returns were of the double-digit variety. Going out 3 years more than 60% of the time returns were positive while they were in the black 85% of the time 5 years later.
So still pretty decent results but the dispersion between the best and worst-case scenarios can certainly leave an uneasy feeling in your stomach.
There’s been plenty of ink spilled on how nasty the crash was in the 1930s but some of the rallies during this time were almost as crazy as the downturns.
When the market finally bottomed in the summer of 1932, stocks were up 38% in July and then and an additional 38% in August. That’s a gain of more than 90% in two months! Even after that gain stocks were still up another 40% a year later.
I guess you could say stocks were a tad oversold after falling 86% or so.
Obviously, past performance tells us nothing about the future. This crisis is one for the history books just like that one but there are too many differences to count.
One hard part about investing during such highly volatile periods is you can talk yourself into just about any scenario.
Sometimes these huge bounces are the real thing. Other times they’re a mirage.
Many investors assume they’re being contrarians right now because they think this is a dead cat bounce within the context of a much larger crash.
Others assume they’re being contrarian right now because they think the worst is over and the market will be able to look past the carnage in the economy.
Then there’s the group that professes to have no clue where we stand in terms of the severity of this bear market.1
One of the things I’ve learned from studying historical downtrends and volatile markets is they tend to open you up to a wider range of outcomes, both to the downside and the upside.
Further Reading:
What Happens to Stocks After a Big Down Month?
Now here’s what I’ve been reading lately:
- Digging moats (Krueger & Catalano)
- Yes, financial literacy programs work (A Teachable Moment)
- What ultra-low yields mean for financial planning (Morningstar)
- This version of Warren Buffett (Reformed Broker)
- The rise and the fall (Irrelevant Investor)
- It’s time to go big (Big Picture)
1Count me in this last group that has no clue where we stand. I just can’t tell if that makes me a contrarian or part of the crowd.

