Last week billionaire hedge fund manager and Carolin Panthers’ owner David Tepper put a scare into the stock market. Here’s what the legendary hedge fund manager told CNBC:
He also said some Big Tech stocks like Amazon, Facebook and Alphabet may be “fully valued.”
Before Wednesday’s sell-off, it was “maybe the second-most overvalued stock market I’ve ever seen,” Tepper said on CNBC’s “Halftime Report.” “I would say ’99 was more overvalued.”
“The market is pretty high and the Fed has put a lot of money in here,” the founder of Appaloosa Management said. “There’s been different misallocation of capital in the markets. Certainly you are seeing pockets of that now in the stock market. The market is by anybody’s standard pretty full.”
The market sold off nearly 2% the day of this interview after selling off 2% the day prior. Comparisons to the dot-com bubble are nothing new but Tepper doesn’t typically make claims like this.
Tepper was actually on CNBC the day the market bottomed (March 23) as well saying, “I’m nibbling right now, for what it’s worth, ” buying stocks such as Amazon, Google, Alibaba and Micron Technology.
He also said the market could fall another 10% to 15%. This wasn’t an outlandish prediction at the time. The market certainly could have seen another leg lower. March was one of the worst market panics we’ve ever seen.
In the more recent interview Tepper said he’s guarded and only net long 10% to 15% of his portfolio (meaning the other 85% to 90% is either hedged or in cash), so it appears he was waiting for a fatter pitch that never came.
With profits falling off a cliff in the coming quarters and stock prices holding strong, Tepper might be right. The stock market could be outrageously overvalued here. But much like the late-1990s dot-com bubble, the market’s valuation is mostly being driven by a handful of companies.
It could just be that the companies Tepper wants to own are wildly overvalued while other parts of the market he and other investors don’t want to own are much cheaper.
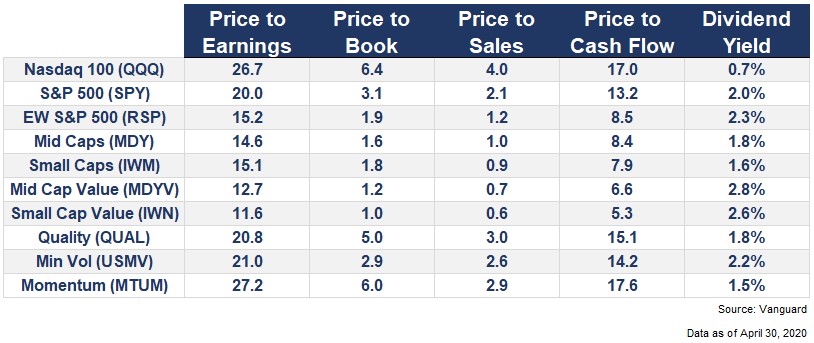
Here’s a look at various valuation metrics for the tech-heavy Nasdaq 100, the S&P 500 and the equal-weighted S&P 500:
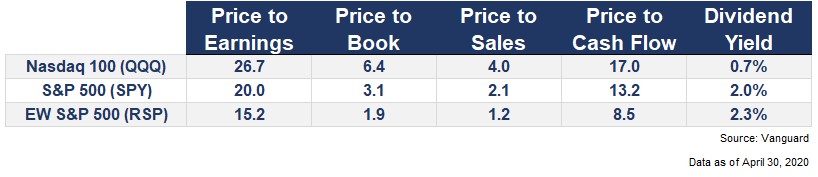
The Nasdaq 100 and S&P 500 are both dominated by tech firms. Microsoft, Apple, Amazon, Google and Facebook make up nearly 46% of the Nasdaq 100 and almost 21% of the S&P 500. The equal-weighted index, just like it sounds, has an equal weighting of every stock in the S&P 500 no matter its market cap.
What this tells us is the bigger names in these indexes.
This is true when you compare large companies to small and mid cap stocks as well:
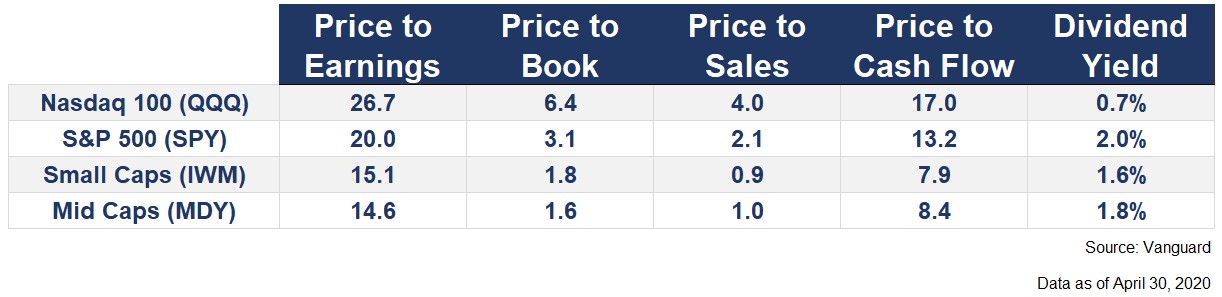
Every valuation metric, save for dividend yield, shows larger stocks are much more expensive than small and mid-sized corporations.
The contrast is even starker when you compare the growth-heavy Nasdaq 100 and S&P 500 to small and mid cap value stocks:
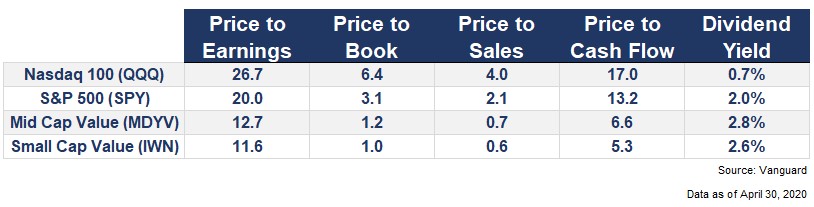
Valuations are multiple times higher in the larger stocks.
It can also be instructive to compare valuations of small and value stocks to other factors including high-quality companies, stocks with lower volatility and momentum names:
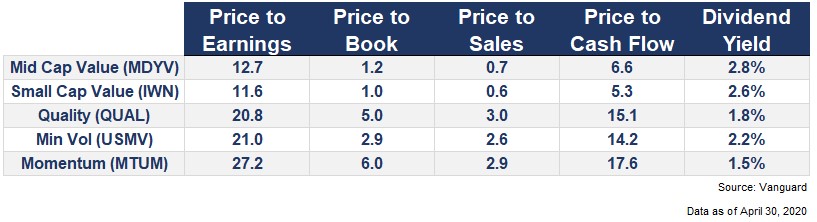
Quality, minimum volatility and momentum are all trading at higher multiples than value stocks.
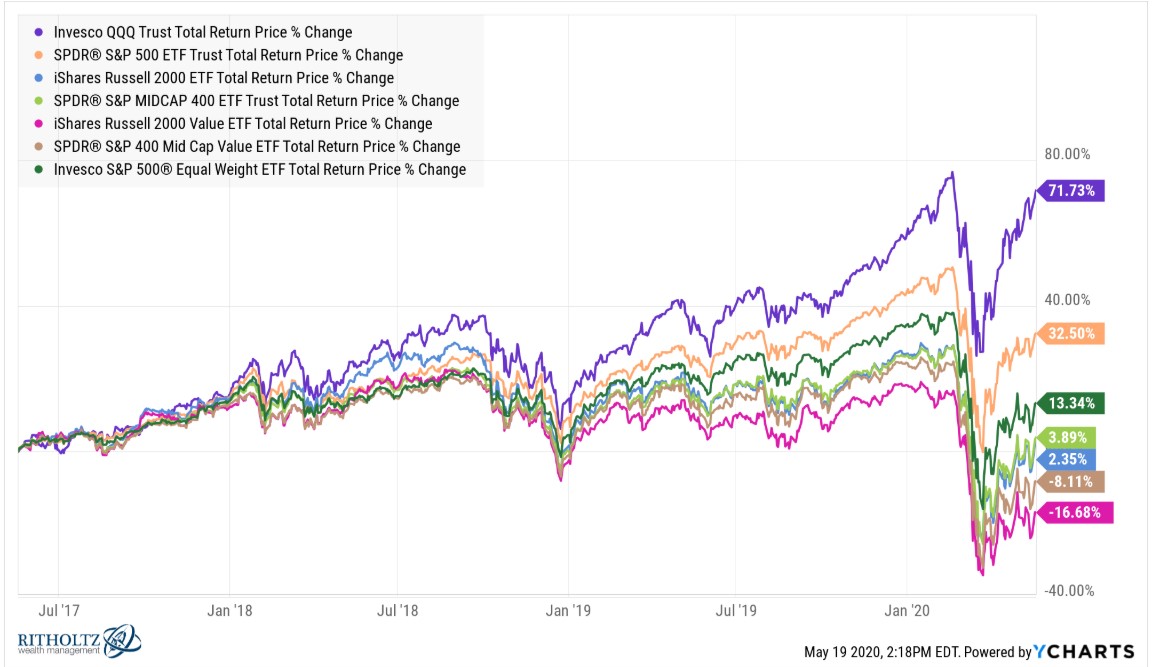
Here’s what it looks like if we bring these various segments of the market together:
There are a number of reasons for these differences. The main one is large and growth stocks have been outperforming small and value stocks for a number of years now by a wide margin:
Investors are also willing to pay up for quality, lower volatility and momentum names in this environment. That’s what typically happens during a downturn.
There are a number of other reasons for valuation differences among the market segments:
- Sector composition and the types of companies
- The increase of intangible assets
- Recent performance and rebalancing effects (this is mostly the case for factors such as momentum, low vol and quality)
- Investor preferences
It’s also true that the valuation of the overall market is never completely in sync with every subset of stocks.
But the differences between the winners and the losers in the stock market is widening to levels not seen in years.
Fortune highlighted a report from Goldman Sachs showing the valuation spreads among the top 20% and bottom 20% of stocks by sector is at its widest point in 20 years:
Even within sectors, the “collective top 20% of stocks from every S&P 500 sector trade at a median [second fiscal year] multiple of 27x, while the bottom 20% of stocks with the same sector composition trade at a multiple of 9x,” Goldman Sachs said in note. That makes the gap within sectors the widest in 20 years, the firm said.
Cliff Asness said in a recent webinar the spread between the most expensive stocks and cheapest stocks by price-to-book is as wide as it’s ever been:
What is the price to book of the top third of expensive stocks divided by the price to book of the bottom one-third of cheap stocks? So the median is about 5.5 — [meaning] throughout history, the median is that expensive stocks sell for 5.5 times more in terms of price-to-book than the cheapest stocks. The current figure is rounding to 12: that’s the highest we’ve ever seen.
Again, a lot of this makes sense at the moment.
It makes sense investors would like to hold growth stocks when interest rates and inflation are low.
It makes sense investors prefer more defensive, higher-quality stocks during a crisis.
It makes sense smaller stocks are being hit harder than larger stocks since many small corporations are finding the crisis more painful to their businesses.
And it makes sense technology stocks would perform so well when they’re making our lives easier during the pandemic.
All of these themes make sense.
And that’s why these companies are so expensive right now. Everyone wants to own them!
Even David Tepper.
Investing is often counterintuitive. Academic research shows that small and unloved value stocks have tended to outperform large and glamourous growth stocks over the long haul. This makes sense when you consider smaller companies have a longer runway to grow than larger companies and glamour stocks tend to be bid up to prices that can’t possibly live up to their embedded expectations.
That’s what makes the current market environment such a head-scratcher to fundamentally-based investors. The winners at the moment aren’t counterintuitive. They actually make sense.
The counterintuitive part of investing comes into play when so many investors agree on the fact that the winners make sense and bid up their prices and valuations to obscene levels.
To borrow a phrase from David Tepper, the stocks that have performed the best look pretty full.
The best companies are now expensive.
There are areas of the stock market that look relatively cheap at the moment.
The only problem is no one wants to own them.
The moral of the story?
Investing is hard.
Further Reading:
Nothin Fails Quite Like Success in the Stock Market
