The speed and turbulence of the stock market’s downturn in February and March was insane. March was the most volatile month since the Great Depression.
The move made sense in many ways, though, because of the pain and confusion caused by the pandemic.
The speed and explosiveness of the market’s rally since late-March is more of a head-scratcher to many market participants. Much of this recovery can be attributed to the fact that the fiscal and monetary response occurred nearly as fast as the bear market itself.
Even with government interventions, I’m not sure any investors would have assumed stocks would be at current levels when they bottomed on March 23.
The S&P 500 was down close to 34% that day and remains in a 9.7% drawdown following a 36% rally ever since:
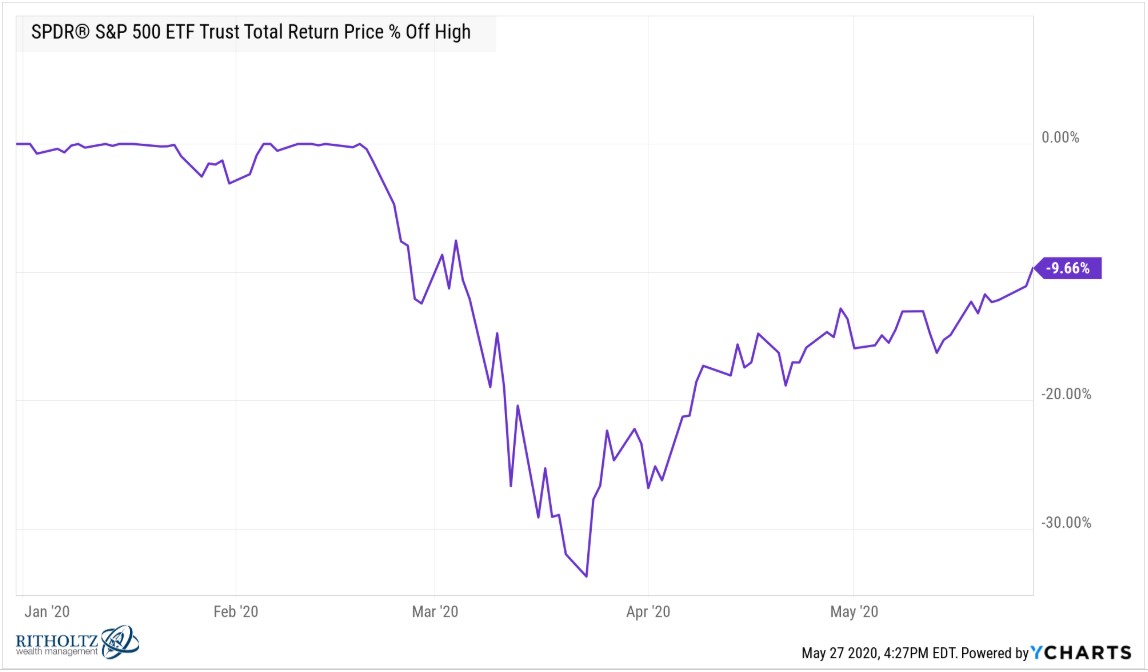
It’s hard to believe after the crash we experienced that the S&P 500 is now showing just single-digit losses on the year.
The biggest tech stocks have held up extremely well throughout the crisis. Since they make up the majority of the Nasdaq 100, that remains one of the best performing indexes this year. Despite the strength in stocks like Amazon, Apple, Microsoft and Google, the Nasdaq 100 did fall nearly 30% in the crash:
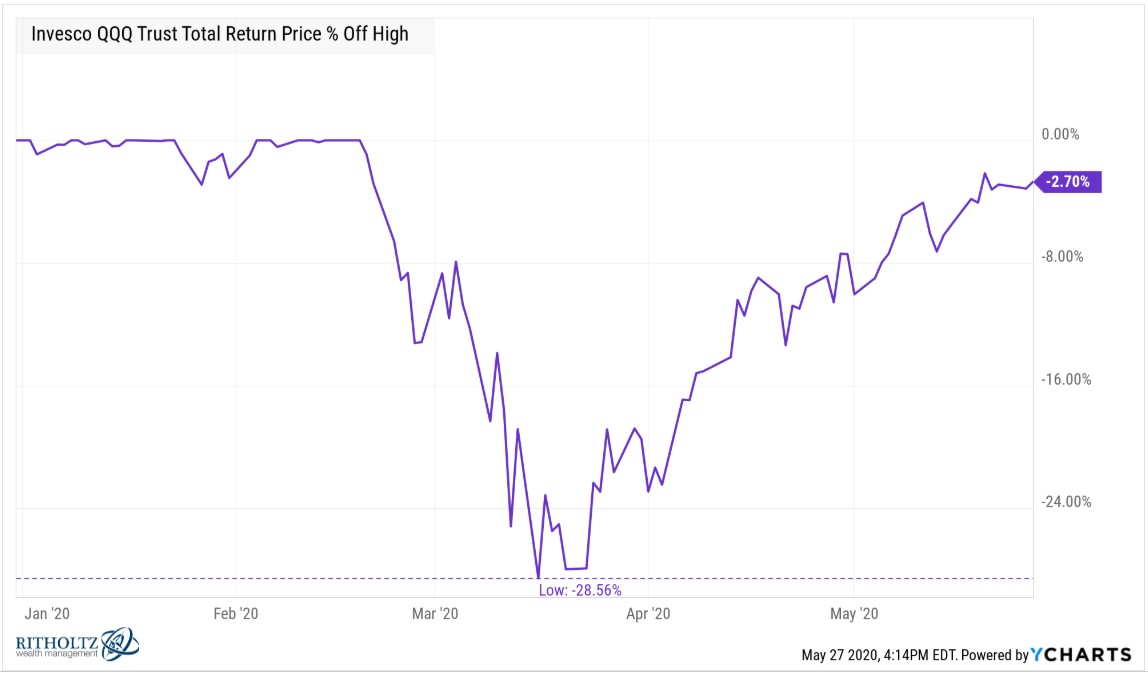
It’s now less than 3% off the highs after recovering most of those losses and up almost 9% on the year. Unreal.
Small-cap stocks were hit much harder than large-cap stocks in the downturn:
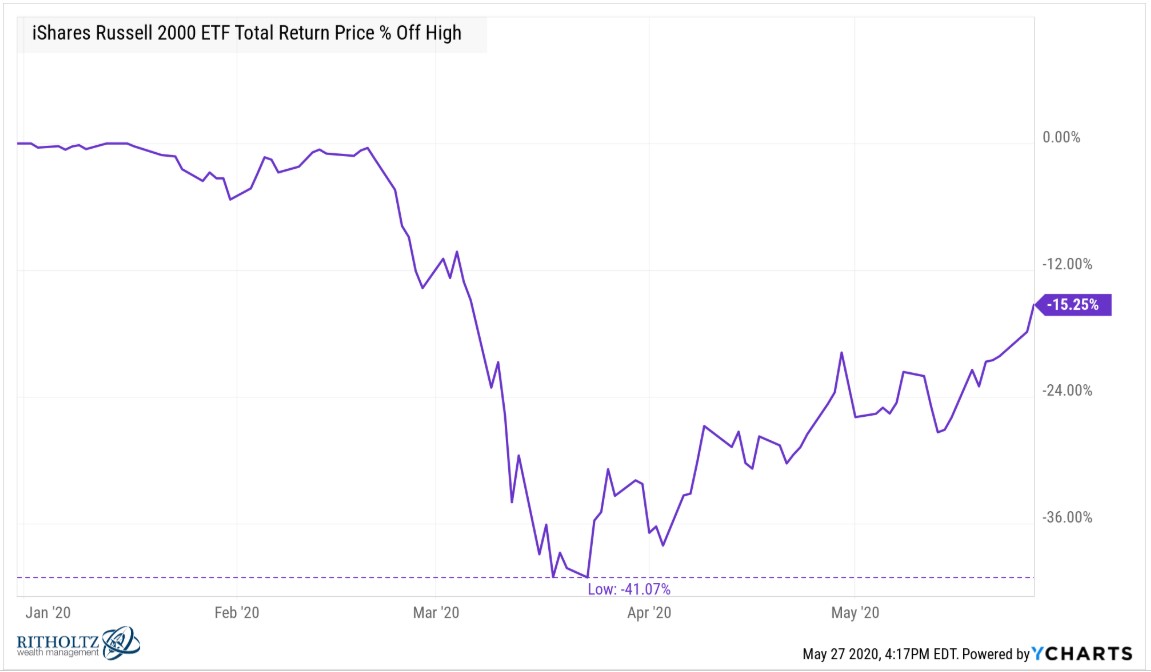
Small caps have experienced a nice bounce but it really is a tale of 3 markets when you look at the returns of these 3 subsets of the U.S. stock market over the past year:
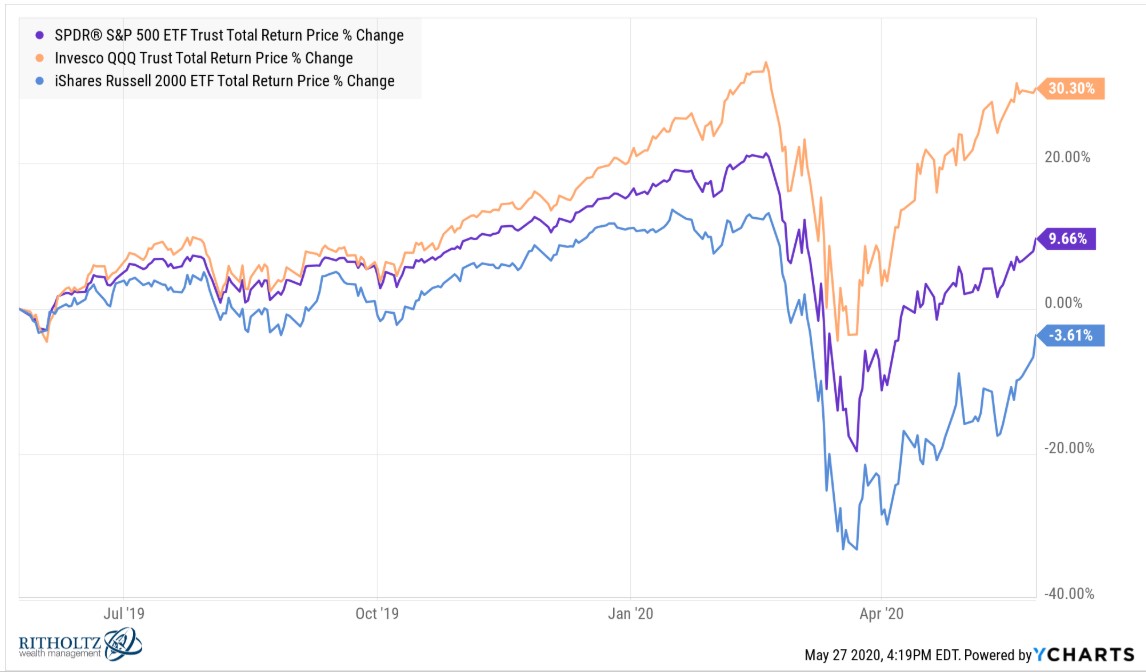
Even with a 29% nose-dive, the Nasdaq 100 is up more than 30% over the past 12 months while small-cap stocks are down nearly 4%.
In the 2008 crisis, emerging markets fell close to 70% (against a 56% fall for the S&P 500) so it may come as a surprise to learn developing country stocks had roughly the same drawdown as large U.S. corporations in this bear market:
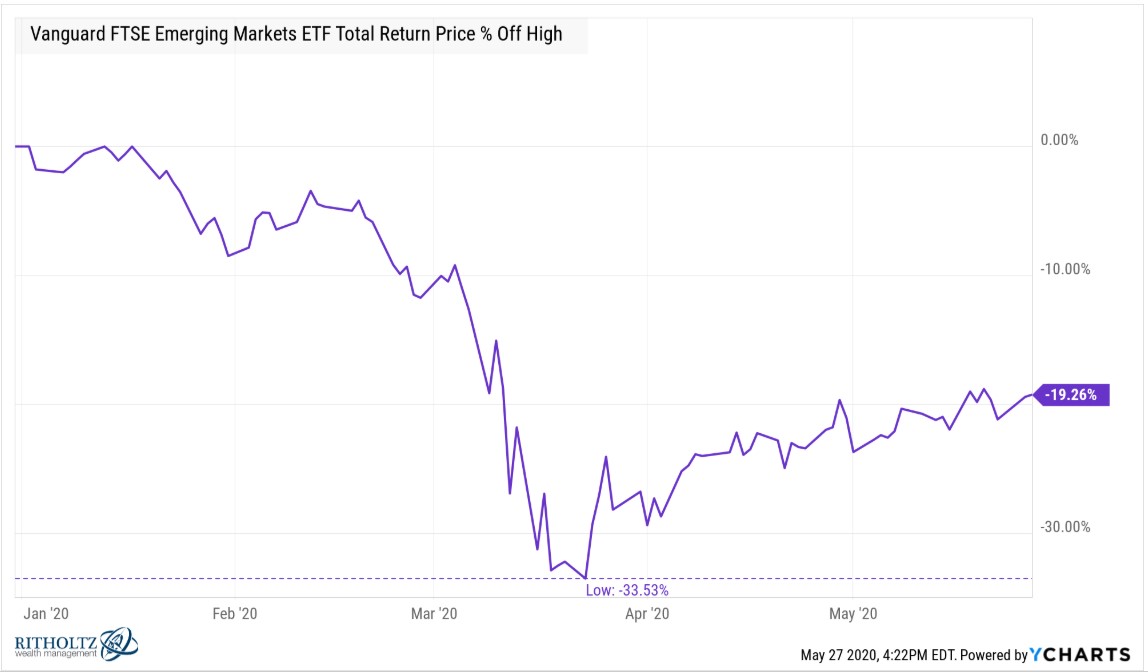
EM hasn’t had the same level of recovery so it remains down nearly 20% this year.
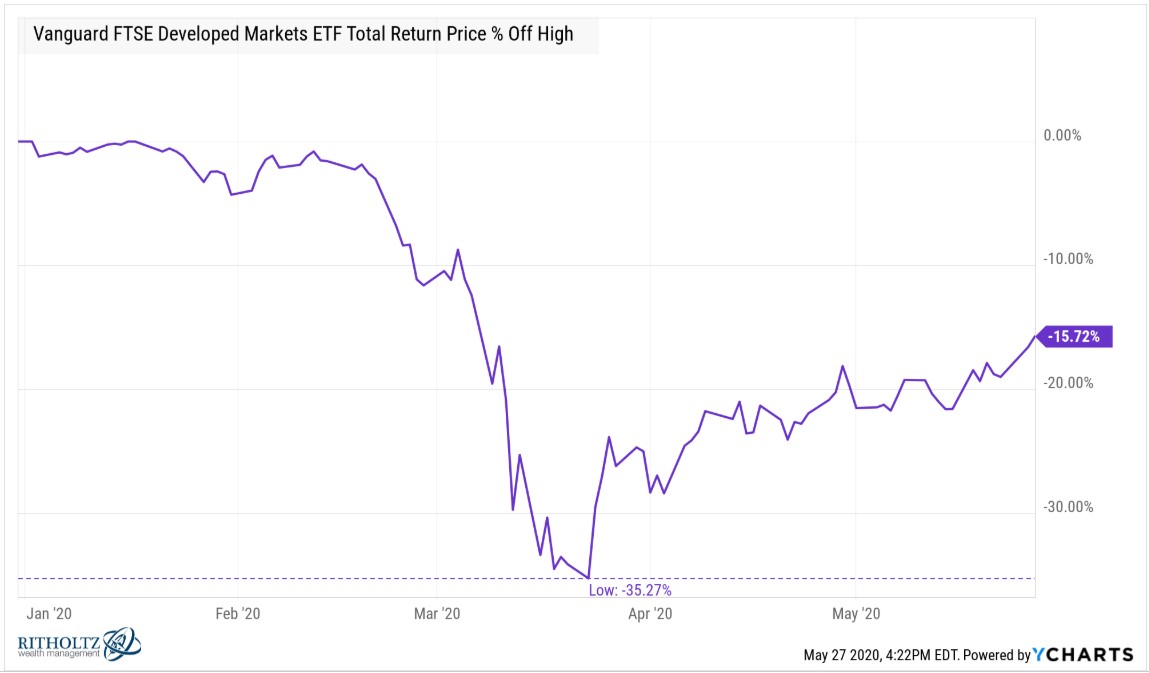
Foreign developed markets actually fell more than emerging markets in this slump but have seen a more pronounced rally:
Here is the summary of the rebounds in each of these markets since the bottom on March 23rd:
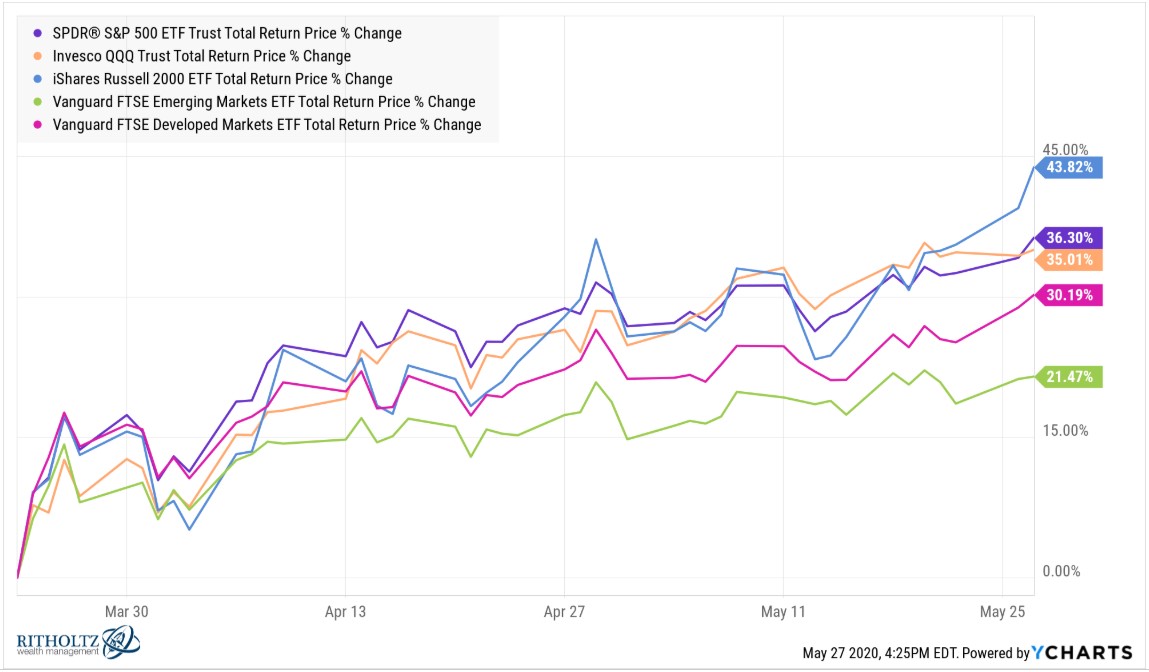
Small-cap stocks have surged more than 43%. Smaller companies tend to lead the way following a bear market1 because:
(1) they get hit so hard during a market crash scenario and
(2) the riskier elements of the market typically lead the way coming out of a crisis
So maybe the market is acting like this is a real recovery but who knows because this year has been more volatile than a Real Housewives of New Jersey reunion special.
Putting this all together you can see stock markets around the world have made up a majority of their losses since late-March:

The S&P 500 sector returns from the bottom of this bear market are also telling:
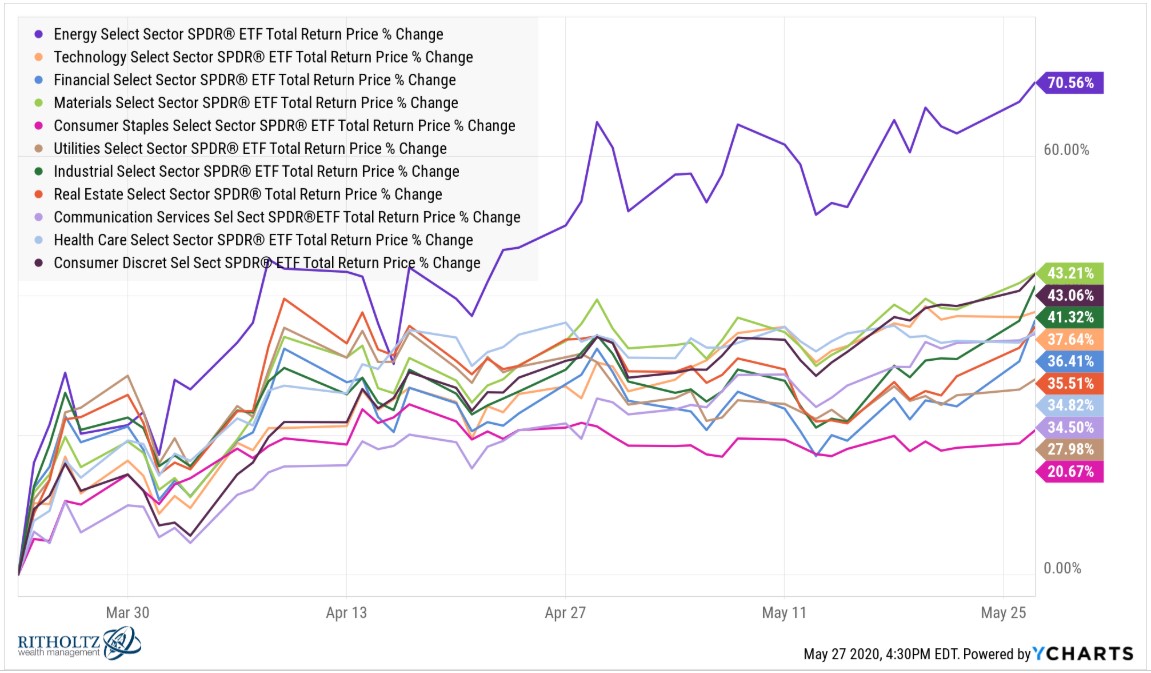
Energy stocks have been getting crushed for a number of years now but they got pummeled more than any sector during the crisis:
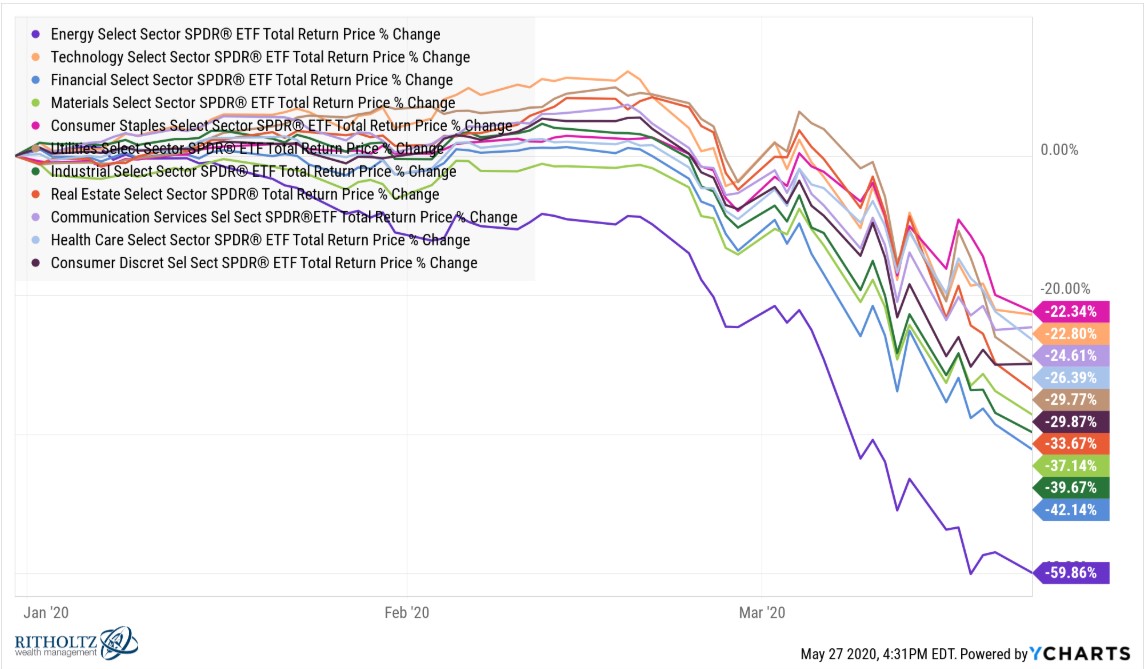
After the initial flush and subsequent advance, this is where each sector sits overall year to date in terms of their drawdowns:
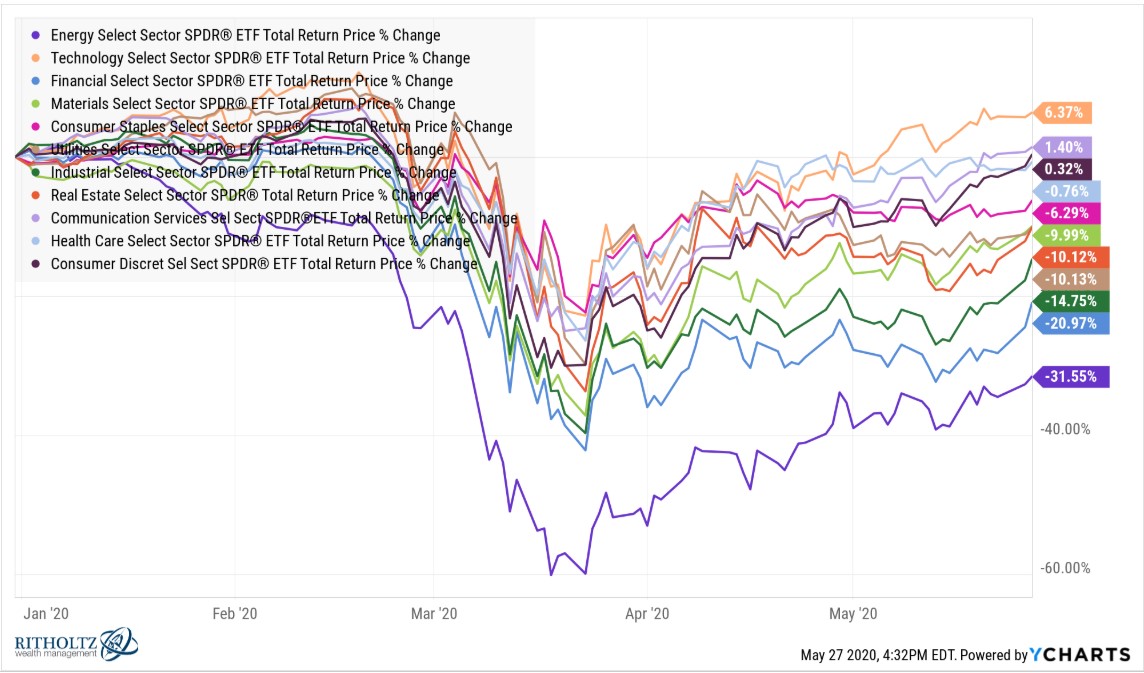
If you’ve been paying attention lately, it’s no surprise technology stocks are leading the way this year, although consumer services and consumer discretionary are also up on the year.
It feels like we’ve already lived through 3 different cycles that would normally take place over the course of a number of years and 2020 hasn’t even reached the halfway point yet.
What a wild year.
Further Reading:
It’s Just Another Manic Market
1I’m not sure we can call this one over yet but we’re getting closer to that point if stocks continue to rise. Maybe we can all agree to forsake bull and bear labels this year since everything is happening so fast.
