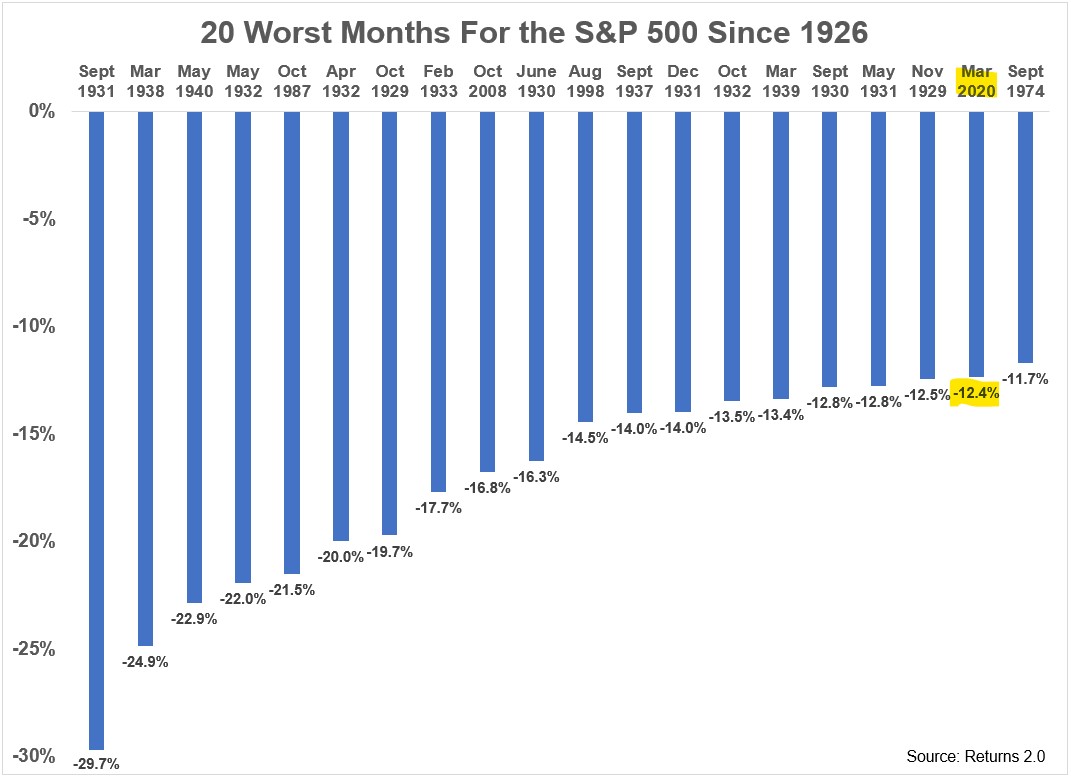
In February the S&P 500 fell more than 8%. Not to be outdone, March was one of the worst months in market history, dropping more than 12%:
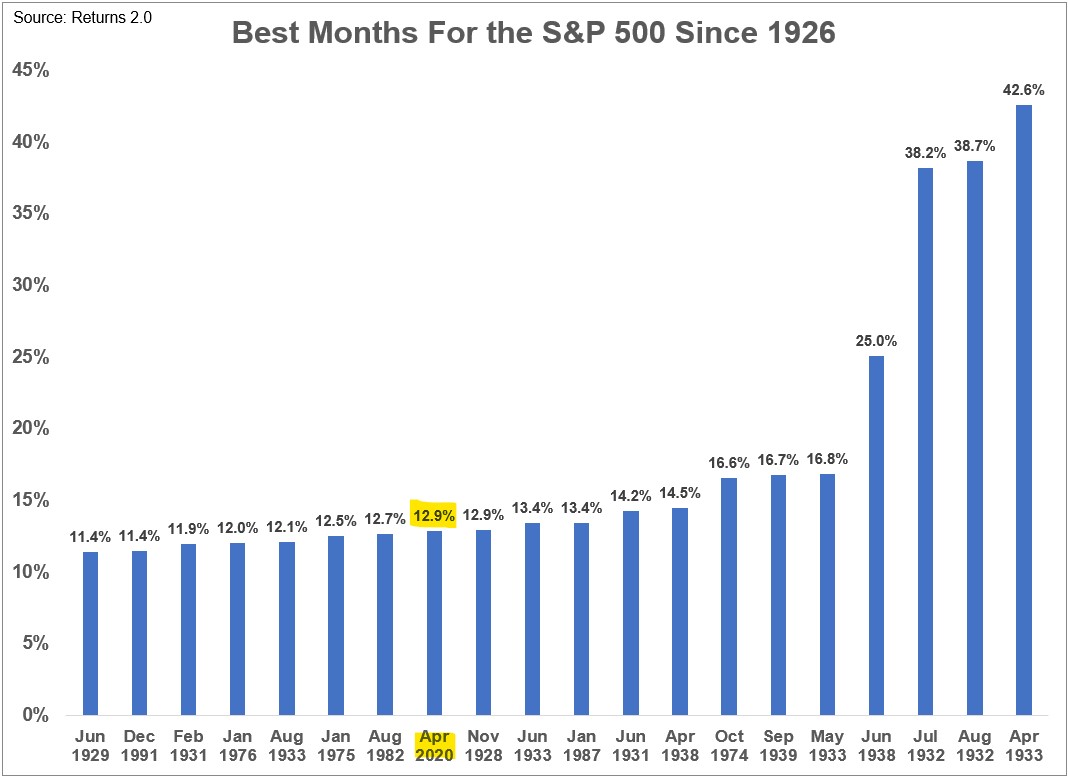
Just to keep investors on their heels, April followed up one of the worst months in history with one of the best ever:
To recap:
- Nasty month in February (-8.2%)
- Even worse month in March (-12.4%)
- Huge snapback rally in April (+12.9%)
Now what?
I wish I had a good answer.
I looked back at the monthly returns on the S&P going back to 1926. I could find exactly one instance where the stock market was down double digits one month and up double digits the next — the fall of 1974.
In September of that year, the S&P 500 fell nearly 12% which was followed by a nearly 17% gain in October (both of which you can see on the charts above).
The good news is the beginning of October marked the bottom of the brutal 1973-1974 bear market which saw stocks get cut in half.1
The bad news is this backtest has a sample size of one which makes it pretty difficult to draw any conclusions from this data other than to say things that rarely happen seem to be happening on a regular basis in 2020.
As of this writing, the S&P 500 is now up 26% or so since the lows seen in late-March but more than 16% off the highs seen in late-February.
Stocks would have to fall 21% to get back to the lows of March 23rd and rise almost 20% to get back to all-time highs. So we’re basically somewhere in-between the best and worst levels of the year at the moment.
We could test the highs or the lows of the year and I wouldn’t be shocked either way.
Benjamin Graham’s Mr. Market analogy remains to this day the best description of the stock market ever concocted. It’s just as relevant today as when he wrote it in the 1940s.
Warren Buffett summed up Graham’s tale of Mr. Market in 1988:
Ben Graham, my friend and teacher, long ago described the mental attitude toward market fluctuations that I believe to be the most conducive to investment success. He said that you should imagine market quotations as coming from a remarkably accommodating fellow named Mr. Market who is your partner in private business. Without fail, Mr. Market appears daily and names a price at which he will either buy your interest or sell you his.
Even though the business that the two of you own may have economic characteristics that are stable, Mr. Market’s quotations will be anything but. For, sad to say, the poor fellow has incurable emotional problems. At times he feels euphoric and can see only the favorable factors affecting the business. When in that mood, he names a very high buy-sell price because he fears that you will snap up his interest and rob him of his imminent gains.
At other times he is depressed and can see nothing but trouble ahead for both the business and the world. On these occasions he will name a very low price, since he is terrified that you will unload your interest on him.
Mr. Market has another endearing characteristic: he doesn’t mind being ignored. If his quotation is uninteresting to you today, he will be back with a new one tomorrow. Transactions are strictly at your option. Under these conditions, the more manic-depressive his behavior, the better for you.
Mr. Market has been as manic as ever over the past 3 months and for good reason. No one knows how to value businesses during a pandemic combined with an economic shutdown.
No one ever knows the direction of the market over the short-term even if the long-term trend has been up. The only thing I’m fairly certain about at the moment when it comes to the stock market is that Mr. Market will continue to offer unstable quotations to investors depending on the day.
Further Reading:
What Happens to Stocks After a Big Down Month?
1Although the market was down again in both November (-4.5%) and December (-1.8%).
