After rising more than 7% on Monday, the S&P 500 closed roughly 21% off all-time highs seen in late-February. The past two weeks or so have seen a bounce of more than 19%, which makes returns over the past year look none too bad, down just 6%.
The same can’t be said about small cap value stocks over the same time frame:
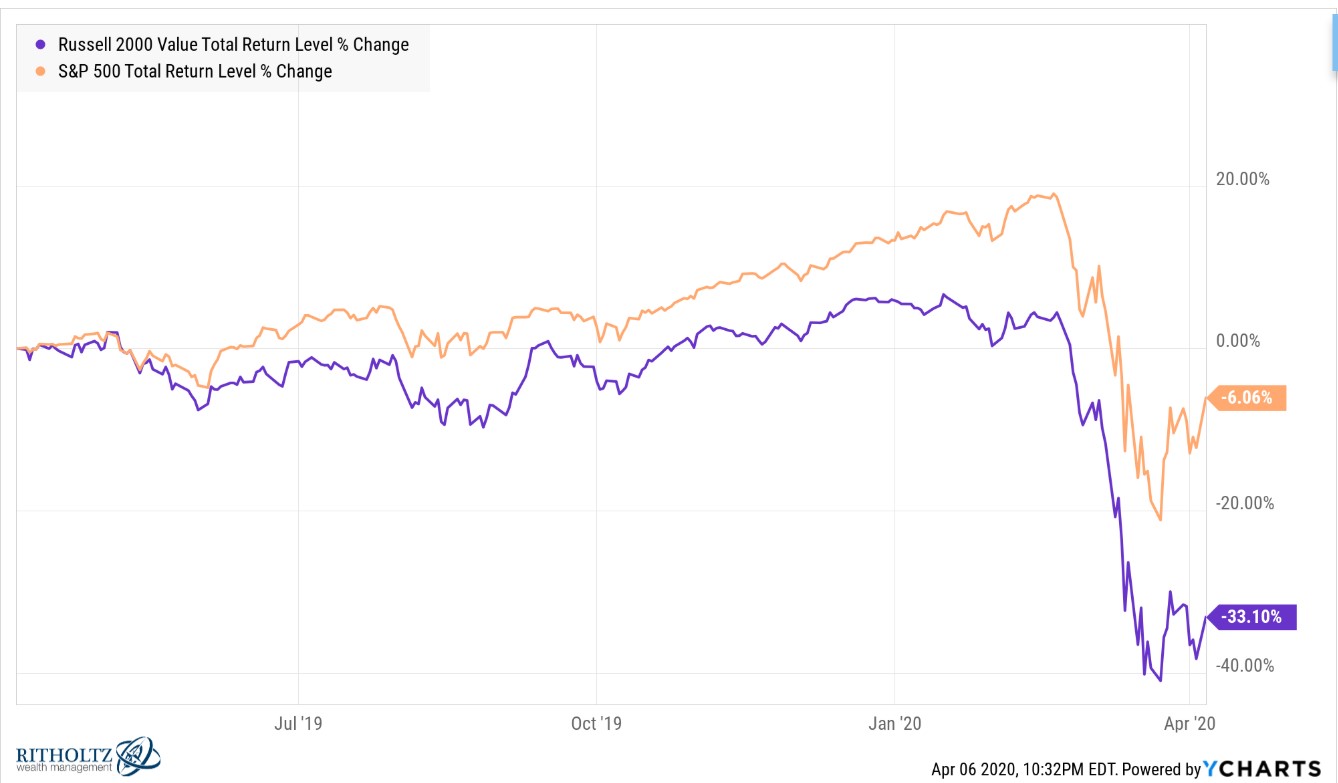
At its trough, the Russell 2000 Value Index was down nearly 45% from the highs. Small cap value stocks are still down well over 30% over the past year.
The 10 year numbers now show an ever-widening gap between the two groups of stocks:
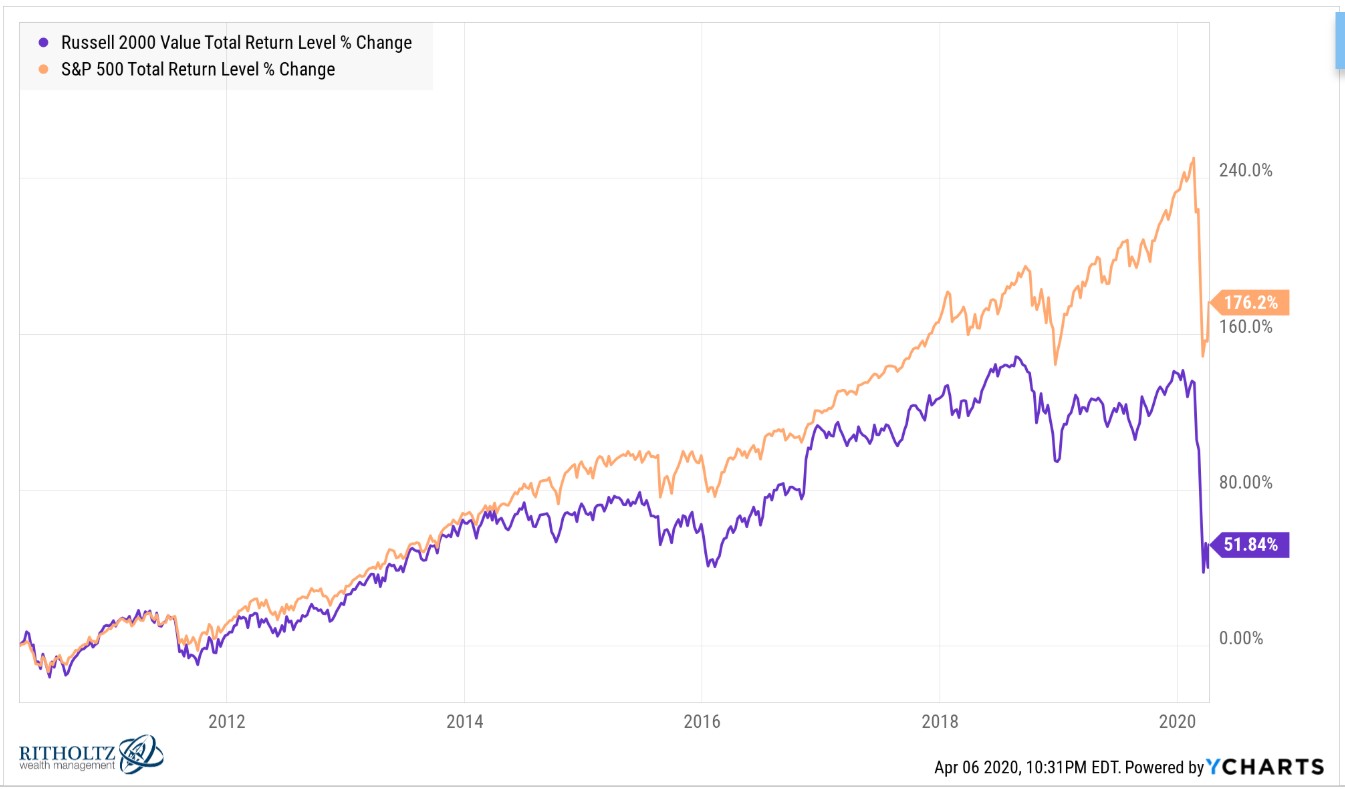
This divergence began just a few years ago but has accelerated precipitously over the past year or so.
During the bull market, large cap growth stocks dominated most other stock market categories. That trend has continued during this sell-off.
In some ways it makes sense. Larger corporations are better equipped to handle the current situation, especially the big technology companies. Smaller companies are likely feeling the pain more acutely from the economic shutdown.
Academic research over the years has shown small cap value to be one of the brightest spots in terms of long-term return potential. You could quibble with this conclusion. Or you could point to the fact that any risk factor is sure to experience periods of relative underperformance.
I’m always willing to see both sides when it comes to the factor investing debate.
Maybe technology has changed the world of factor investing forever or maybe this is an inevitable part of the cycle for small cap value that proves why it’s so difficult to stick with a winning strategy over the long-term.
Time will tell.
For those who do have small cap value in their portfolio, the saving grace could come on the other side of this bear market. Historically small cap value stocks have earned a decent amount of their long-term premium in the aftermath of a bear market.
Using S&P 500 bear markets going back to the late-1920s, I looked at the performance1 of the S&P and small cap value stocks coming out of these periods over the ensuing one, three and five year periods:
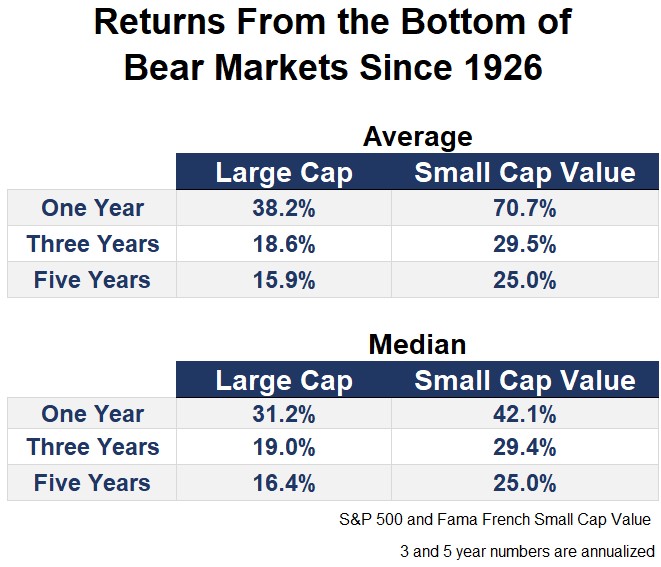
You can see the returns coming out of a crisis tend to be far stronger in small value stocks than their large cap brethren. In fact, the numbers have been substantially higher.
Caveats do abound here. Although Fama-French data goes back to 1926, before the 1980s or so it would have basically been impossible to put together a diversified basket of small cap value stocks as you can today in a simple quantitatively-constructed ETF or mutual fund.
Much of the pre-1960 data for small companies is difficult to put into a real world context because so many of these companies were illiquid and hard to trade.
Here are a few recent examples investors can hang their hats on from the last two crises:
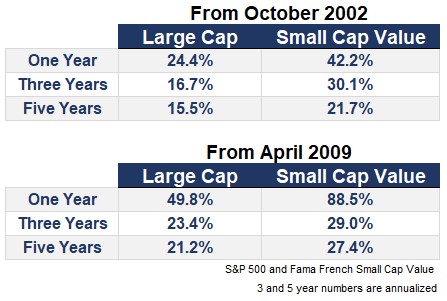
I would never go so far as guaranteeing this will happen again. It’s possible the winners going into this crisis will be the winners coming out of it. It’s also possible hard hit areas like small cap value are a compressed spring coil ready to bounce even higher on the way back up.
Using history as a guide can be imperfect because investors don’t live in a world of averages. But in the past, smaller value stocks have done far better than their larger counterparts during the recovery from a bear market.
Now if we could only figure out exactly when this bear market will be over…
Further Reading:
Is Software Eating Value Investing?
1 I don’t have good daily data for small cap value stocks going back this far so I just picked the closest month to use as a starting point. So these returns aren’t from the exact bottom but get you close enough.
