The S&P 500 just bounced more than 27% in 15 trading days, its largest gain over such a short period of time since 1933.
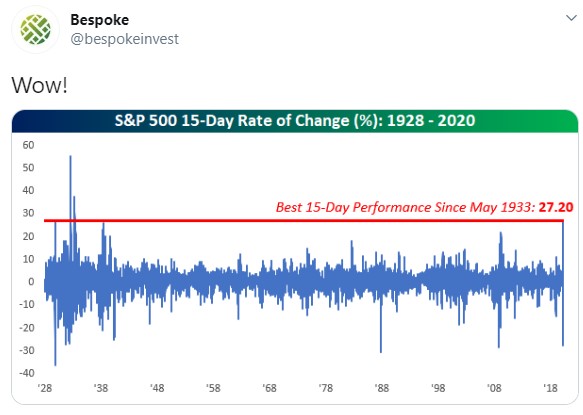
This is a wild bounce within the midst of a depression-like scenario but as we’ve seen in prior market crashes, these types of bounces can and will happen. No one knows if this is a dead cat bounce or something that marked the absolute bottom but I’m guessing most investors assume there is more pain to come.
There have now been 22 million jobless claims out of a labor force of 165 million in the past 4 weeks alone. That’s more than 13% of the workforce that’s now out of work and that number has to be on the low side when you consider the number of people who work in the gig economy, have been furloughed or moved to part-time.
The economic pain is becoming really real, really fast and it likely won’t stop for some time.
Reasons for another leg down in stocks are obvious — the economy is grinding to a halt (save for a handful of sectors), retail spending is falling off a cliff, industrial production is sure to fall, companies will pull back investments, and no one really knows when we get back to normal.
To balance out this pain we’ve had increased unemployment benefits, corporate bailouts, checks sent directly from the government to households, small business loans, and helicopter money being dropped all across the financial system from the Fed.
The risks and counter-risks are widely known at this point.
Obviously, the mystery factor here is the psyche of investors. Do investors really believe the Federal Reserve and the federal government have done enough to shore up an economy that has effectively been turned off?
I have more questions than answers but it can also be instructive to look at the current make-up of the U.S. stock market to gain a better sense of what would need to happen in order for the stock market to roll over in a big way.
The Russell 3000 is a representative proxy for the entire U.S. stock market. While it excludes some microcaps and OTC stocks, it makes up the vast majority of U.S. stocks and currently represents more than 2,800 publicly traded companies.
If the entire stock market is going to crash further from current levels it’s going to have to come from the biggest stocks in the index. The R3000 currently has a collective market cap of around $30.4 trillion. The top 30 names out of 2,882 stocks in total account for $11.8 trillion in market cap.
That means the biggest 30 stocks are roughly 39% of the total market. Since the stock market is market-cap-weighted, meaning the biggest companies have the biggest weights, you would likely have to see some serious selling in these names for the market to fall substantially more than where it was at the lows in late-March.
And within those 30 biggest stocks, it’s really 10 technology stocks that have carried the load this year in terms of performance. Here are the year-to-date returns for Microsoft, Amazon, Google, Apple, Facebook, Intel, Netflix, Nvidia, Cisco and Oracle against the overall market:
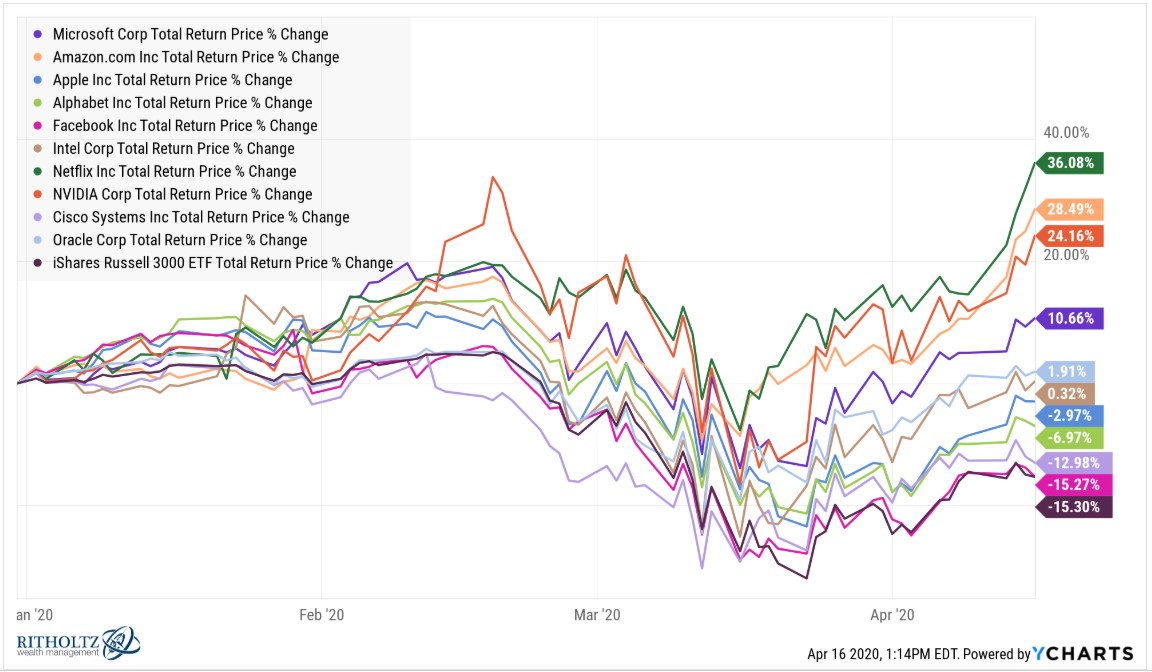
Each one of these stocks has outperformed the market this year1 with Facebook being the only big tech name that’s roughly in line with the market. And 5 out of the 10 biggest tech stocks are actually up on the year.
You can see the big slice of the overall stock market big tech has these days:
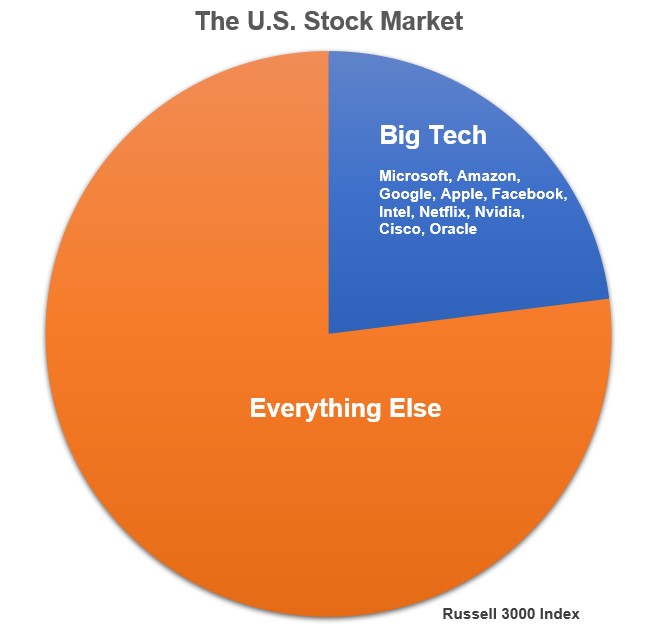
These 10 stocks make up roughly 23% of the entire U.S. stock market.
I’m not saying these stocks can’t or won’t go down. It’s always possible those stocks that have held up the best so far will play catch up if there is another downturn at some point.
But what if these tech companies are better positioned to weather the storm? What if they don’t fall nearly as much as the rest of the market if there is another re-test of the lows or a further leg down?
As of March 23, the Russell 3000 was down 35% from all-time highs. After rising 25% or so, the stock market would need to fall almost 20% from here to get back to those levels. To reach a 40% drawdown from all-time highs the market would need to fall nearly 26% from here. And to see stocks cut in half from all-time highs we would need a further 40% drawdown from here.
This is just a thought experiment but what if big tech continued to hold up if any of these various scenarios came to fruition? How much would the rest of the market have to fall if the market begins to crash again but big tech only experiences 60% of the total losses?
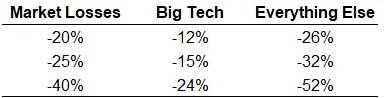
I’m completely pulling this 60% number out of thin air but this shows if the 10 biggest tech stocks continue to outperform on a relative basis, everything else would have to get crushed for the market to fall further.
That’s certainly possible but it’s also true that everything else basically has gotten crushed already. Here are the 2020 returns for the overall market (R3000), the equal-weighted S&P 500 (RSP), mid caps (IWR), small caps (IWM) and micro caps (IWC):
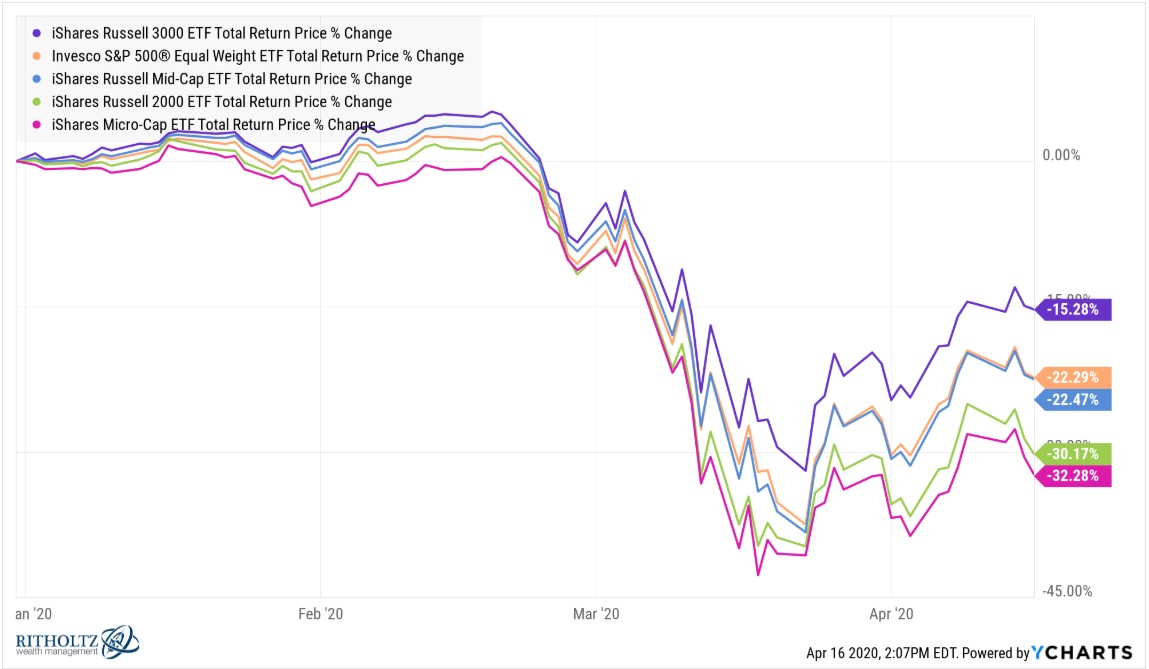
While the Russell 3000 is down 15%, the equal-weighted S&P 500 has fallen 22%, mid caps are down 22%, small caps have fallen 30% and micro caps are down 32%. At their lows, these other asset classes were down 39%, 41%, 41% and 43%, respectively.
Could everything fall in lockstep if/when we have another leg down during this crisis?
Of course. There’s nothing that says the way things have gone thus far will continue ad infinitum.
But based strictly on the way the stock market operates, if you’re overly bearish on the prospects for U.S. stocks, you would likely have to see the biggest tech stocks get hit in a big way to bring the entire market to the depths some people are predicting.
I’m not saying that can’t happen. Few companies will prove to be completely immune from this economic crisis.
Some people will say big tech will continue to lead the charge. Others assume it’s only a matter of time until things catch up with these stocks.
At this point, nothing would surprise me either way but it’s important to understand how the stock market is structured before making a bet for either a bottom or another crash.
Further Reading:
Why Valuations Don’t Always Matter During a Bear Market
1These numbers are updated through the afternoon of April 16.

