You know we’re living in wild times when “Oil Prices Go Negative” is only like the 12th craziest headline of the year in the markets.
I’m adding this one (via the NY Times) to my list of charts that look like they could only happen during an alien invasion:
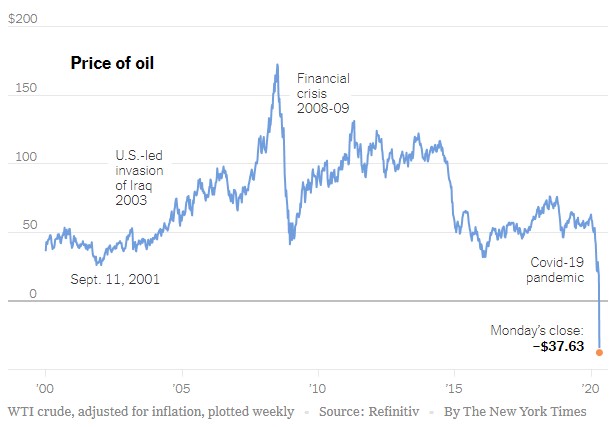
There are fundamental (demand for oil drying up from the economic slowdown) and technical (the timing of futures contracts, ETF rebalancing, etc.) reasons for this price point but this is an insane move in one of the most important commodities in the world.
It’s crazy to think oil hit more than $150/barrel briefly in the summer of 2008 before the financial crisis shifted into overdrive. People at the time were worried oil was going to the moon. An energy analyst at Goldman Sachs predicted $200/barrel was coming because of “the world’s seemingly unquenchable thirst for oil.”
Peak oil stories have been going around since the 1970s but as recently as 2013 the National Geographic ran the following cover story:
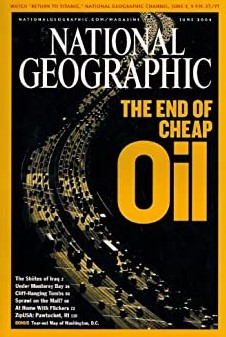
I’m not trying to poke fun at these predictions but rather show how difficult it can be to predict the path of this black stuff we extract from the ground. I would never want to be tasked with that job.
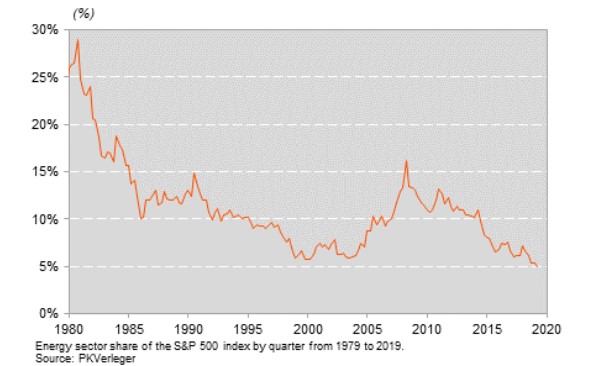
When oil peaked in the summer of 2008, the energy sector made up nearly 17% of the S&P 500.
Today it makes up just 2.8% of the index and that weighting is falling fast. It’s hard to believe this number was nearly 30% in 1980:
This list shows the top 10 stocks in the S&P 500 every 5 years going back to 1980:
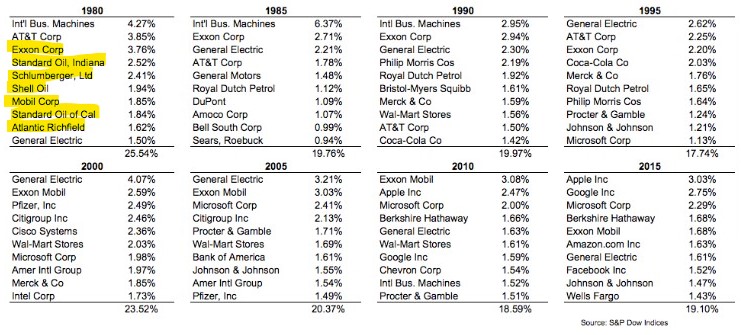
In 1980, 7 out of the top 10 names were energy companies. Exxon was in the top 3 in 1980, 1985, 1990, 1995, 2000, 2005 and 2010. The current list has no energy stocks.
Exxon is still the 26th largest company in the S&P 500 but it’s the rest of the industry that has fallen off the most. Chevron and Exxon together make up roughly 47% of the SPDR Energy ETF (XLE). Their combined market cap of roughly $331 billion makes up nearly half the $646 billion market cap of the remaining 25 companies in the fund.
Obviously, the biggest reason the energy sector has collapsed relative to the rest of the S&P 500 is because performance has been so awful. Here’s the comparison since the end of June 2008:
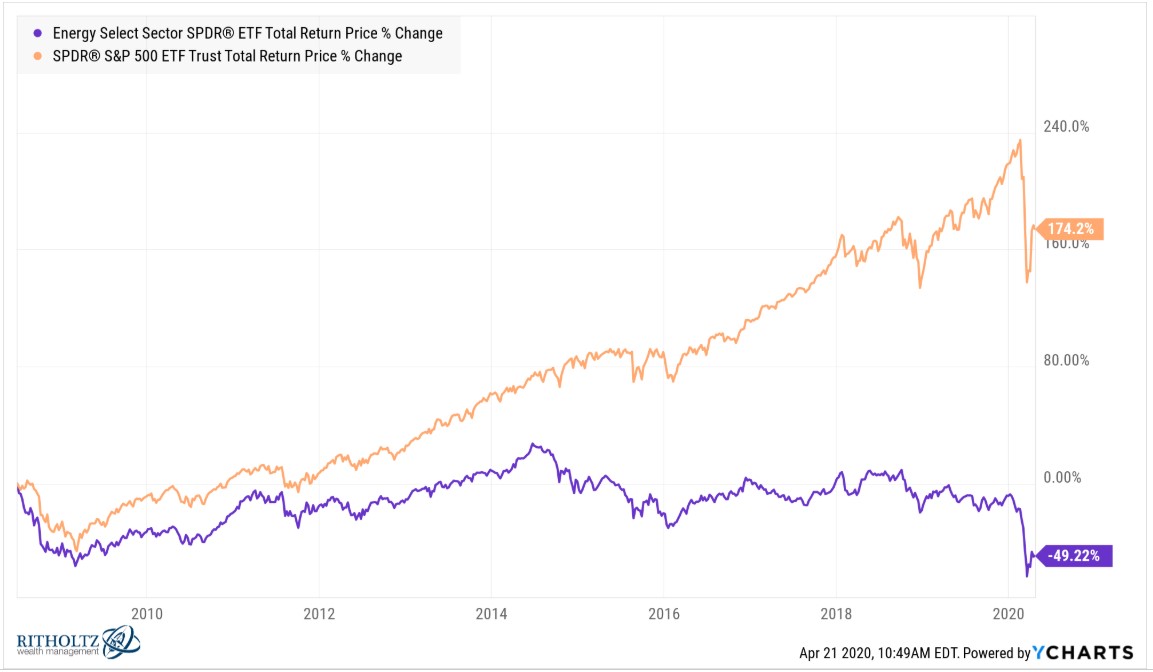
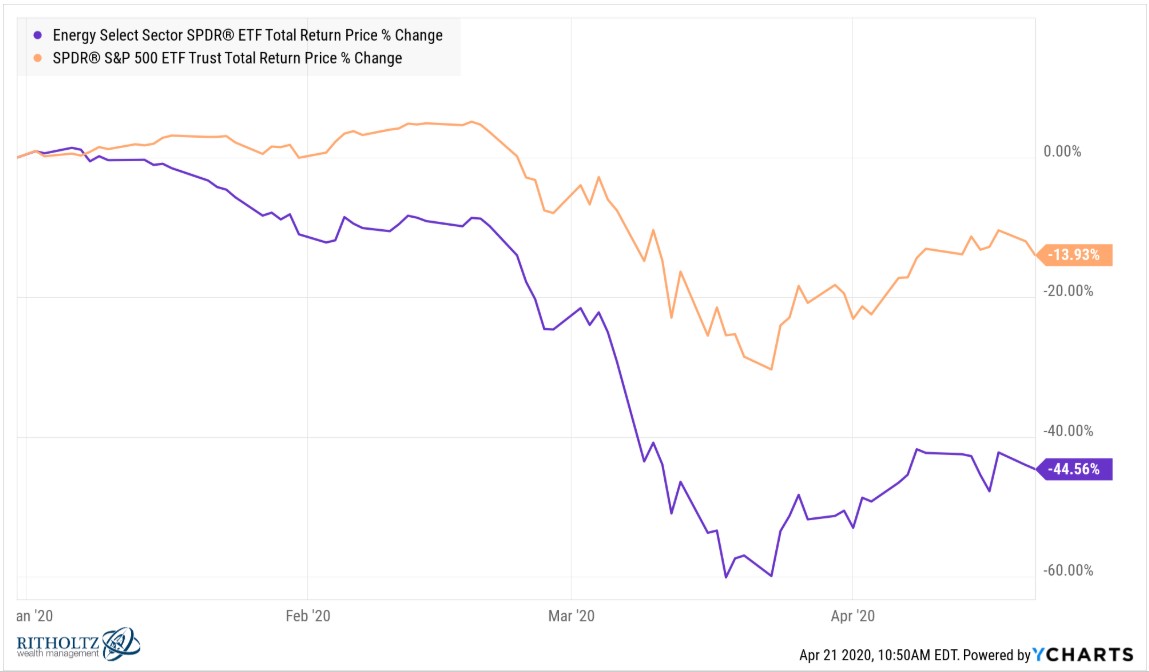
And as bad as things have been in the stock market overall this year, they’ve been much worse in energy:
One of the most impressive aspects of the stock market is how adaptable it is over time. The energy sector dominated the market at a number of junctures over the past 40 years or so but it’s also seen its relative importance in the index fall off a cliff.
Yet the S&P 500 is still up nearly 7000% in total (11% per year) since 1980 despite seeing the this once might industry wane in relative importance.
It’s taken me a while to finish it because the book is so long but I’ve been reading Titan: The Life of John D. Rockefeller on and off for the past year. In the book biographer extraordinaire Ron Chernow describes the wild price swings in oil when Rockefeller was building his oil empire:
The price fluctuations in a single year were staggering, veering between 10¢ and $10 a barrel in 1861 and $4 and $12 in 1864.
Over the past two days the price of oil was trading below levels seen in the 1860s!
Surprisingly, investors haven’t been rushing to the exits during the oil price crash. They’ve been rushing in with the thinking that the time to buy is when there are oil barrels in the streets. Look at the assets under management in the US Oil ETF (USO) in recent weeks:
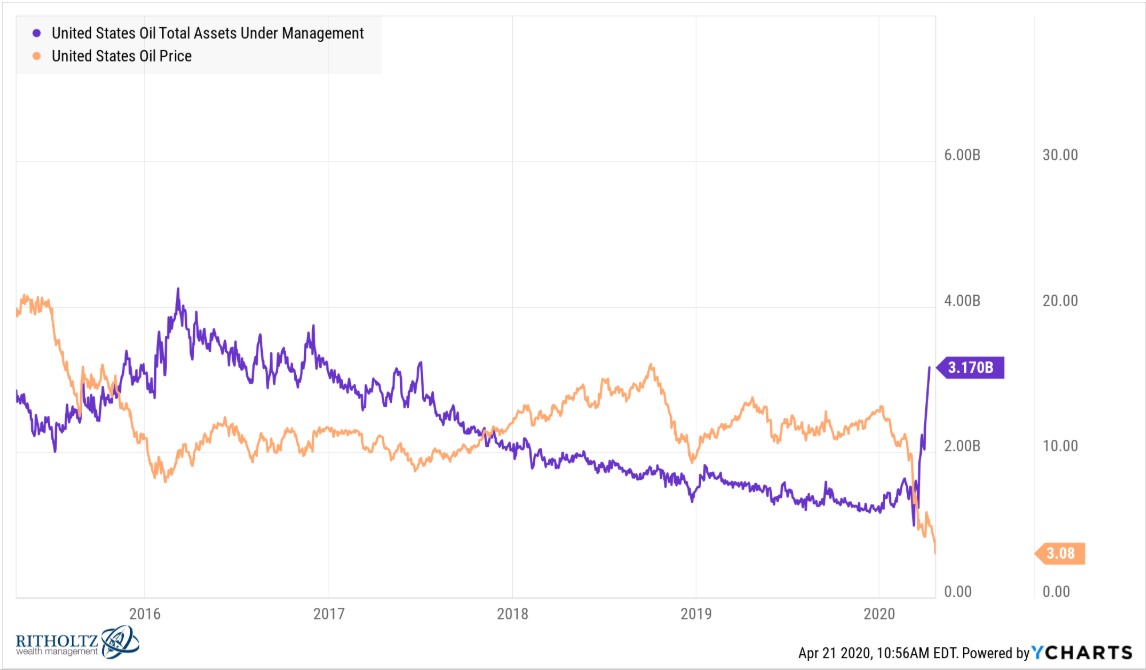
And this AUM data is through April 9, 2020. Today the fund went over $4 billion in assets as retail traders poured money in under the assumption that oil prices can’t stay negative forever.
Catching a falling knife in energy stocks is hard enough at the moment. Energy names have been underperforming for years but that hasn’t stopped them from underperforming even more.
But catching a falling knife in the actual commodity itself is even harder because you’re dealing with futures contracts, creations/redemptions in ETFs, collapsing demand and market dynamics we’ve never seen before.
Howard Marks once said, “There’s nothing intelligent to be said about the future of the price of oil.”
Markets are ridiculously confusing at the moment. Trying to predict the future path of any market right now is beyond challenging.
Especially in the short-term, oil might be one of the hardest paths to predict so if you do plan on entering this space I would urge you to do so with a large helping of caution and an open mind.
Even with oil prices falling for some time now no one would have predicted negative prices or the craziness we’ve seen in the past couple of days.
What comes next is anyone’s guess but this will go down in the pantheon of boom-bust cycles in the energy sector.
Further Reading:
The Biggest Stocks
