One of the reasons we’re living in the golden age of the individual investor is the number of research and investing tools available for free.
When I first started working in the investment industry, all the tools we used were subscription-based or pay-to-play. There are still things worth paying for but also a number of useful free stuff on the web.
I’ve been using NYU professor Aswath Damodaran’s annual asset class returns for years now. It’s updated once a year and includes annual returns since 1928 for:
- Stocks (S&P 500)
- Bonds (10-year treasuries)
- Cash (3-month t-bills)
I went through and calculated the annual return numbers for each from 1928-2019:
- Stocks +9.7%
- Bonds +4.9%
- Cash +3.4%
Then there’s a column for growth of $100 since 1928 which looks like this:
- Stocks $502,417.21
- Bonds $8,012.89
- Cash $2,079.94
He also includes the annual inflation so you can look at the returns on a real basis:
- Stocks +6.7%
- Bonds +1.9%
- Cash +0.4%
Inflation in the U.S. has remained low for some time now but this wasn’t always the case:
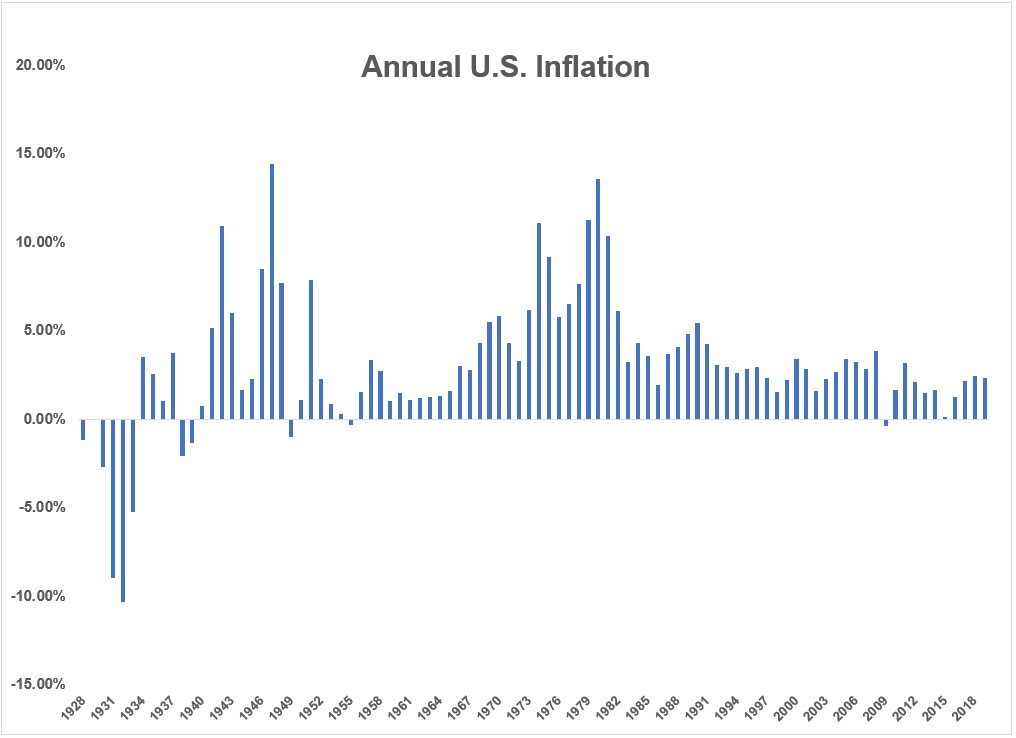
You can see two inflationary spikes on the chart. One which occurred during WWII and one in the late-1970s and early-1980s. Since then, inflation has remained relatively calm by historical standards.
From 1942-1948, inflation in the U.S. was more than 63%. From 1977-1981 it was nearly 60%. Since 1998, inflation has totaled 60%. That means it’s taken 22 years to see the kind of inflation people were forced to deal with over 7 and 5 year periods in the past.
Is it possible inflation stays subdued for the foreseeable future? There’s a good case to be made for this based on demographics and growth expectations.
But we can never tell for sure and even if the long-term trend remains one of lower inflation it’s impossible to predict outlier events which could cause short-term inflationary spikes.
It’s also instructive to see the wide range in outcomes that can occur in the 3 asset classes with the highest, average and minimum calendar year returns:
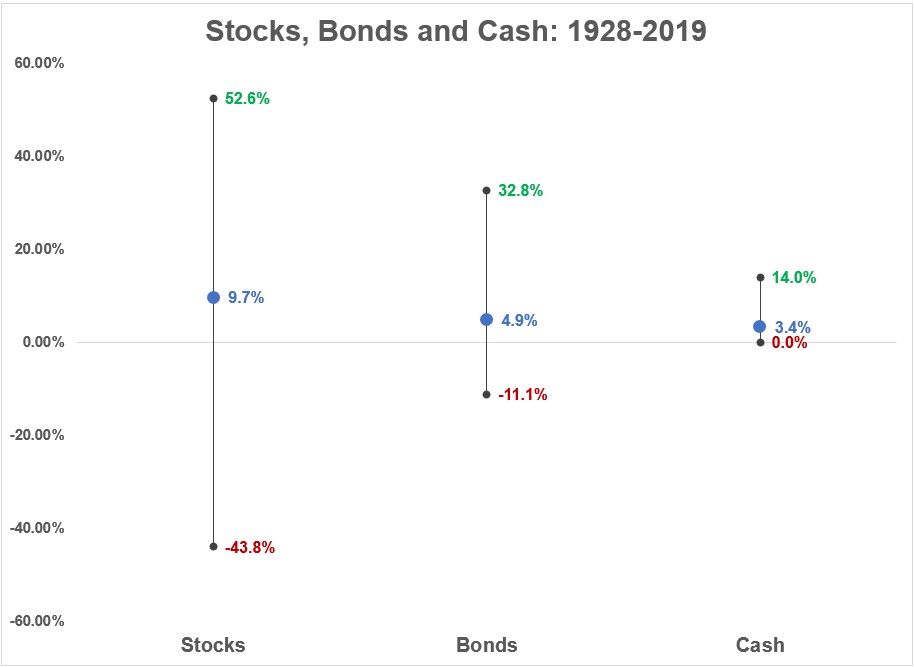
Long-run returns are impossible to predict exactly but I could give you a range (call it 4% to 12%) over a 30-40 year period in the stock market and feel fairly safe about that range. But over the short-run the range of results is big enough to drive six Teslas through.
Over the past 92 years the annual returns for the S&P 500 were 9.7% but nearly 70% of all calendar years saw returns that were higher than +10% or lower than -10%. So most of the time stocks are either up big or down big.
Bonds, on the other hand, experienced just a single year in which they were down double-digits (2009 when they fell 11%). It’s inflation that’s the killer for bonds. While 10-year treasuries experienced just 17 down years out of 92 since 1928, on an inflation-adjusted basis, they were down 40 years or nearly 44% of the time.
Cash has never had a down year which feels pretty good in the short-term. But 3-month t-bills were down after accounting for inflation 38 out of 92 years. Stocks were down 30 out of 92 years on a real basis.
Also just for fun, let’s look at annual returns for these asset classes on a number of different timelines.
The markets since 1980 have been amazing because that period began with ridiculously low valuations and ridiculously high-interest rates:
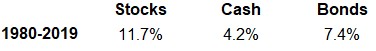
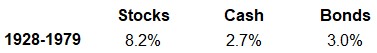
Stocks have done excellent but bond returns are otherworldly when compared to the pre-1980s markets. The returns before 1980 are decent but nothing like we’ve seen since then:
But it is amazing how much impact the Great Depression had on long-term stock returns. Here’s what things look like from a 1933 starting point with that crash out of the equation:
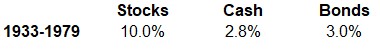 That’s almost 2% per year that the Great Depression lops off.
Now here are the returns over the past 20 years which may have been the worst starting point in U.S. stock market history:
Even with the excellent returns of the past 11 years or so, bonds have almost beat stocks this century. Now here are the past 11 years:
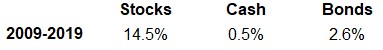
The total returns for the S&P 500 from 2009-2019 (+345%) were better than the total returns from 2000-2019 (+221%) by a wide margin.
Obviously, all of this is cherry-picking. We can’t simply remove the worst crash in history or only think about stocks from their best or worst entry points. But looking at asset class returns over a number of different market environments can help set better expectations for what’s to come.
Maybe a better way to think about this is to look at each decade in terms of asset class annual returns and inflation:
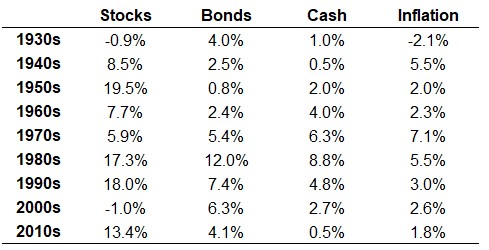
Again, arbitrary start and end dates but no two decades look the same in terms of stocks, bonds, cash and inflation.
Further Reading:
The Best Free Investing Tools on the Web
