Investors have an endless supply of things to worry about simply because we know more about the markets than previous generations of investors.
The massive growth of technology stocks over the past decade or so gives many investors pause about how this impacts the market structure. In this piece I wrote for Fortune I look at this worry through a historical lens.
*******
Microsoft, Apple, Google, Amazon and Facebook have collectively added $4.4 trillion in market cap gains since 2013 and are now the 5 largest stocks in the S&P 500.
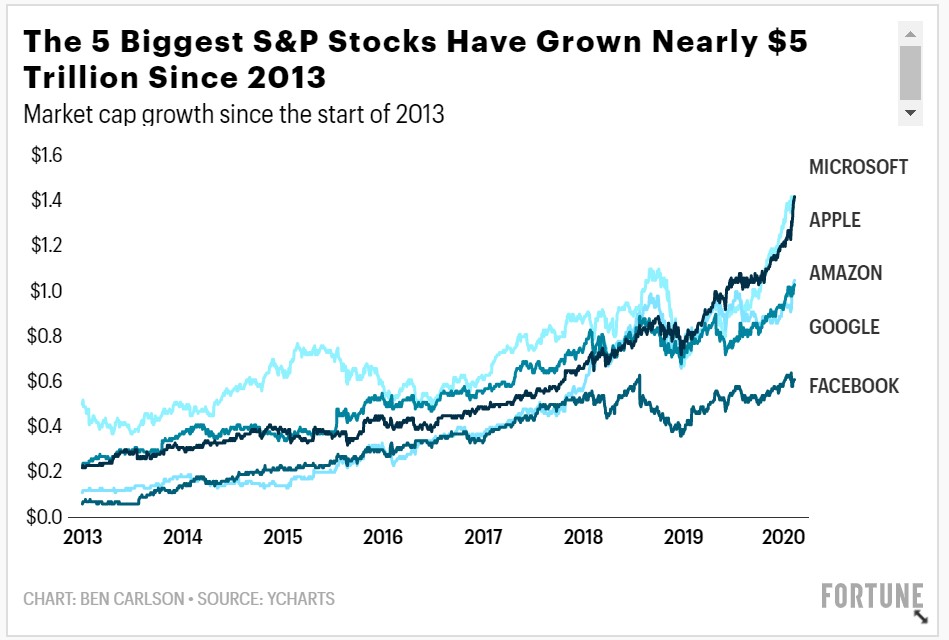
This spectacular growth means these 5 companies alone now make up more than 18% of the S&P 500. This massive growth also means these companies now have an outsized impact on the performance of the market itself. According to S&P Dow Jones Indices, these 5 tech stocks were responsible for more than 20% of the S&P 500’s 31% return in 2019.
When you see a handful of stocks dominate in such a way it can make some investors nervous. What happens to the stock market if these companies begin to sell off? Is the rest of the market participating in this rally or is it all being driven by just a small number of stocks?
It’s important to remember that concentration in stock market gains in the S&P 500 is a feature, not a bug. In a market-cap-weighted index, the majority of the gains will invariably come from the largest names. This doesn’t mean smaller stocks aren’t participating in the rally, just that they don’t move the needle for the overall market.
Market breadth is a way to gauge the number of stocks rising versus the number that are falling to understand how much of the market is participating in a rally or downturn. In the late-1990s dot-com bubble, there was a noticeable divergence between the stock market and the NYSE advance-decline line, which simply measures the ratio of the number of stocks rising over the number of stocks falling.
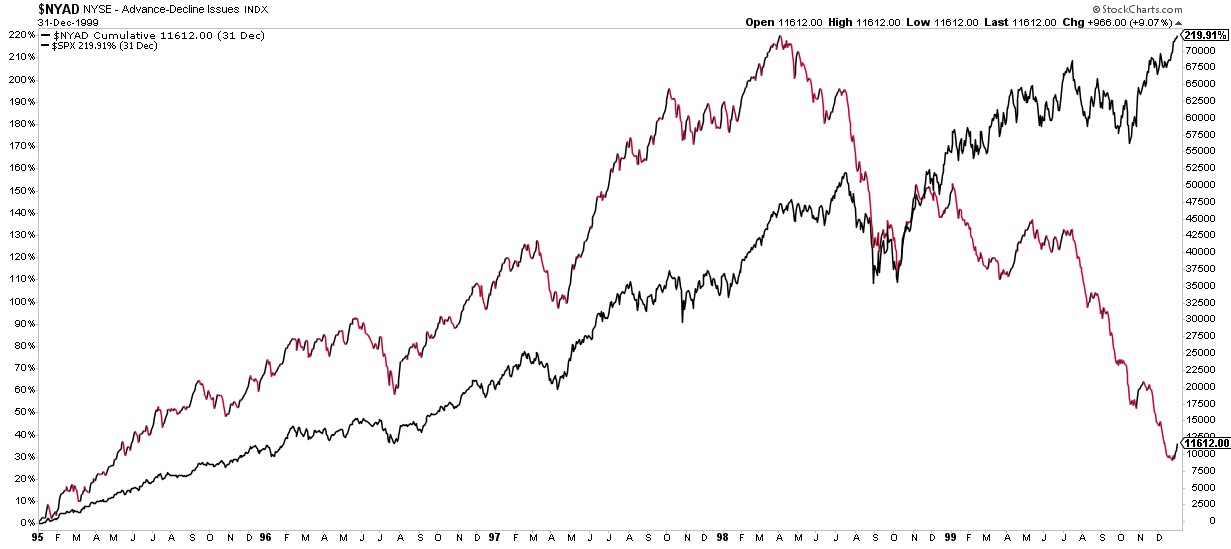
The fact that the advance-decline line was crashing while the market kept rising was a good sign only a handful of big stocks were propping up the market. This was a good warning sign for the bear market that would follow.
Now here’s the same measure since 2013:
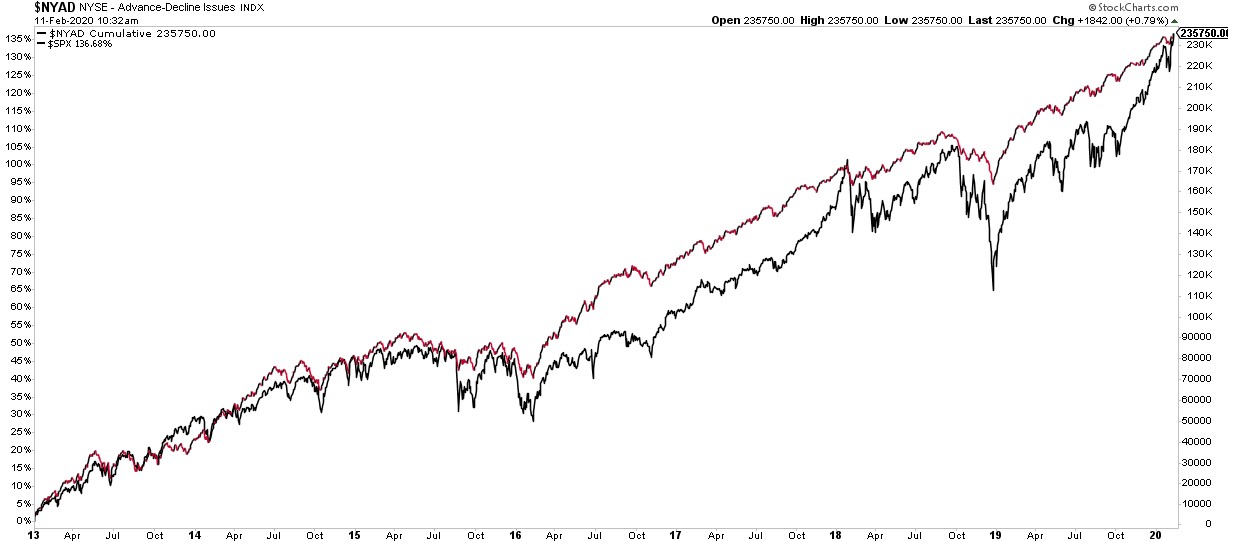
There have been some minor divergences but for the most part the advance-decline line has tracked the upward move in the market. What this tells us is smaller and medium stocks are also rising. This one measure doesn’t tell you exactly when to get in or get out but it can help us understand the underlying health of the stock market.
This is nothing new
The concentration at the top of the S&P 500 has been increasing in recent years but when we look at these numbers historically this is nothing new. Here are the 10 biggest stocks in the S&P 500 at the outset of every decade going back to the 1980s:
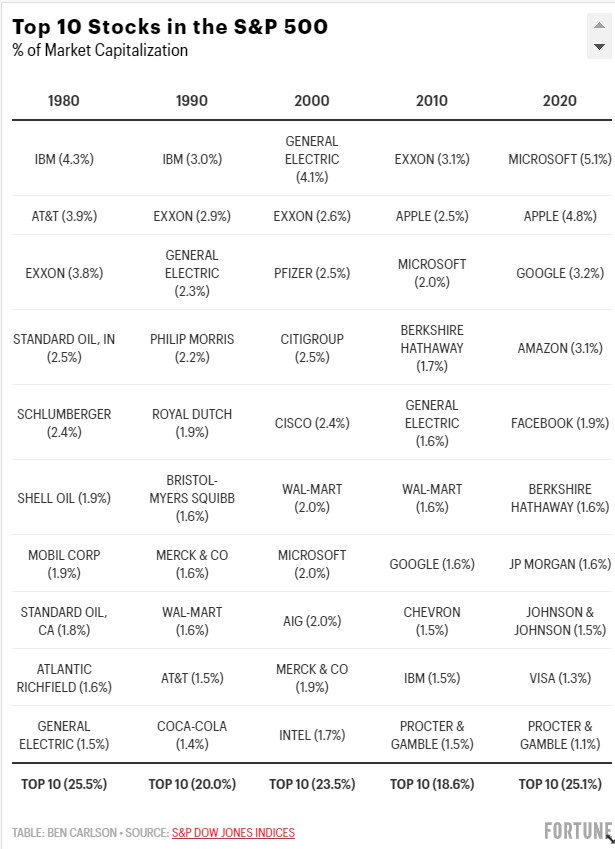
One of the things that jumps out from this list is how high the turnover at the top can be. Every decade there were at least five to six new names at the top of the list. While technology firms dominate the top slots today, in the early-1980s it was energy companies.
There have also been some brutal corrections in a number of the stocks that populated the top 10 lists of the past. General Electric is down more than 50% in total since it held the top slot in the year 2000. Citi and AIG also populated the list of biggest stocks at the turn of the century. They are down 73% and 95%, respectively, since then. Exxon was the largest stock in the S&P 500 in 2010. Since then the stock has underperformed the index by nearly 250%.
While the 25% concentration in the top 10 names today feels high, that’s right where it was in 1980. And the market was even more concentrated if we take things further back. In 1965, AT&T made up nearly 8% of the index. General Motors was another 7%. The top 10 holdings were 34% of the S&P 500. In the early 1960s the top 10 holdings at one time made up over 50% of the S&P!
The average lifespan of a company in the S&P back in the 1960s was around 60 years. Today that number is closer to 20 years. This comes from a combination of mergers, disruption and companies going bust.
The behemoth tech stocks have taken advantage of these trends but it was not preordained that these companies would be where they are today. Apple was rescued by Microsoft with a $150 million loan in 1997 which was one year before Google was founded. Jeff Bezos started Amazon in a garage in 1994. Facebook was founded in a dorm room in just 2004 and just went public in 2012. It feels like these companies can do no wrong right now and maybe they’ve all built up impenetrable barriers to entry and lasting brands but history says not all of them will remain at the top in the decades to come.
Concentration has always been a part of the stock market’s structure. Today is no different than the past in that respect. The biggest surprise would be if every one of these stocks remains in the top 10 by 2030.
(One part I forgot to include here is the fact that the market-cap-weighted S&P 500 is up roughly 260% over the past 10 years while the equal-weighted S&P 500 is up roughly 240%. Other stocks are rising, not just the big dogs.)
This piece was originally published at Fortune. Re-posted here with permission.
