Recency bias is a well-known phenomenon at this point because pop psychology books (and movies based on these books) have brought behavioral economics to the masses. It’s the idea that we look to the recent past to judge performance or make decisions about the future.
Recency runs rampant in the stock market but looking at the performance from one year tells us little about what will happen in the following year. Here’s a piece I wrote at Fortune that looks at 2018 and 2019 in more detail to show why this is the case.
*******
The stock market just finished a rollicking 2019. The S&P was up nearly 32% including dividends. These types of gains present something of a double-edged sword for the investor psyche though.
On the one hand, huge gains are always a pleasant surprise and better than the alternative. On the other hand, investors become nervous following big gains because the assumption is a crash will be soon to follow.
The truth is there is little signal in the noise of year-to-year stock market returns. What happened last year has no bearing on what happens this year. Historically, the percentage of gains in the stock market following a variety of scenarios is fairly similar:
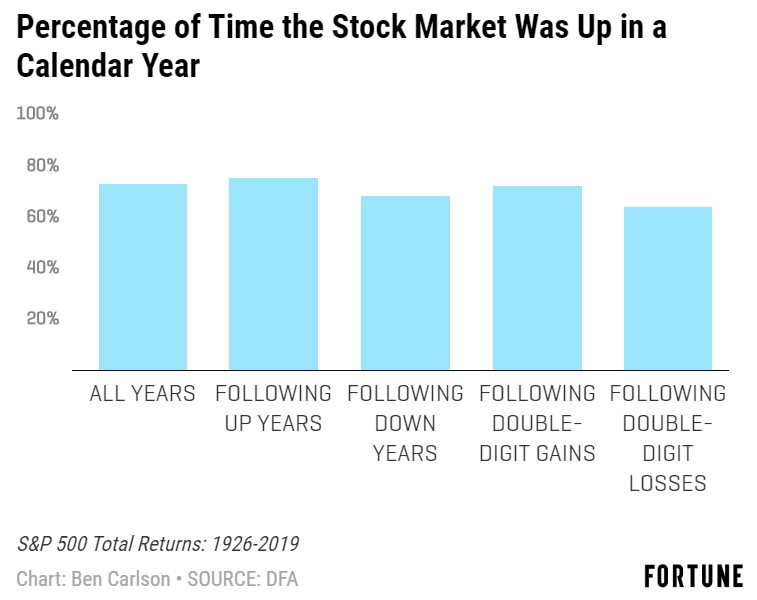
Since 1926, the S&P 500 has been up roughly three out of every four years. But we can also break these numbers down by the percentage of time stocks are up in a calendar year following an up year, down year, double-digit gain or double-digit loss. On average, the percentage of time stocks are up the following year is relatively similar.
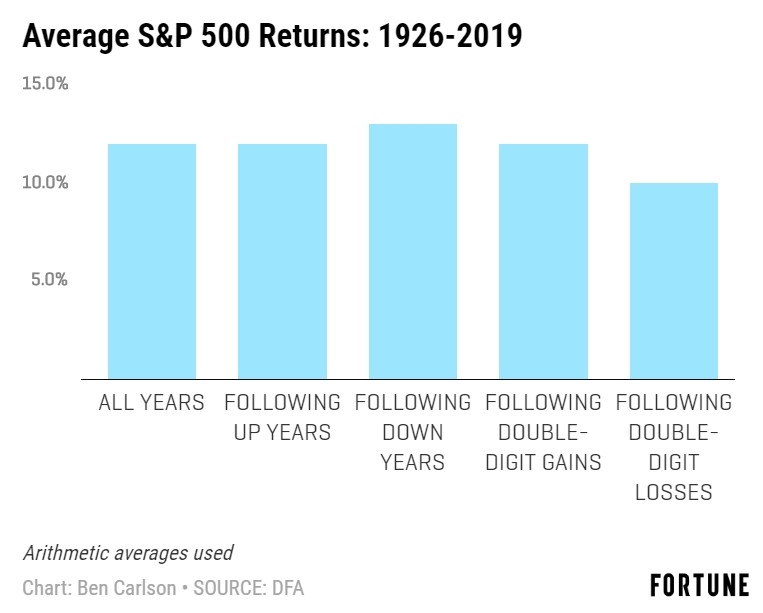
On average, stocks go up most of the time. Of course, within those average returns is a wide range of outcomes, both to the upside and the downside. Investors can get a better sense of this range of outcomes by comparing what happened in the S&P 500 in 2018 and 2019.
2018 was the first down year of the decade in the 2010s for the S&P 500, falling more than 4%.
2019 was the eighteenth calendar year since 1928 which saw the S&P 500 rise 30% or more. This means gains of 30% or more have happened in roughly one out of every five calendar years.
In 2018 there were 18 new all-time highs in the S&P 500.
In 2019 there were 35 new all-time highs in the S&P 500.
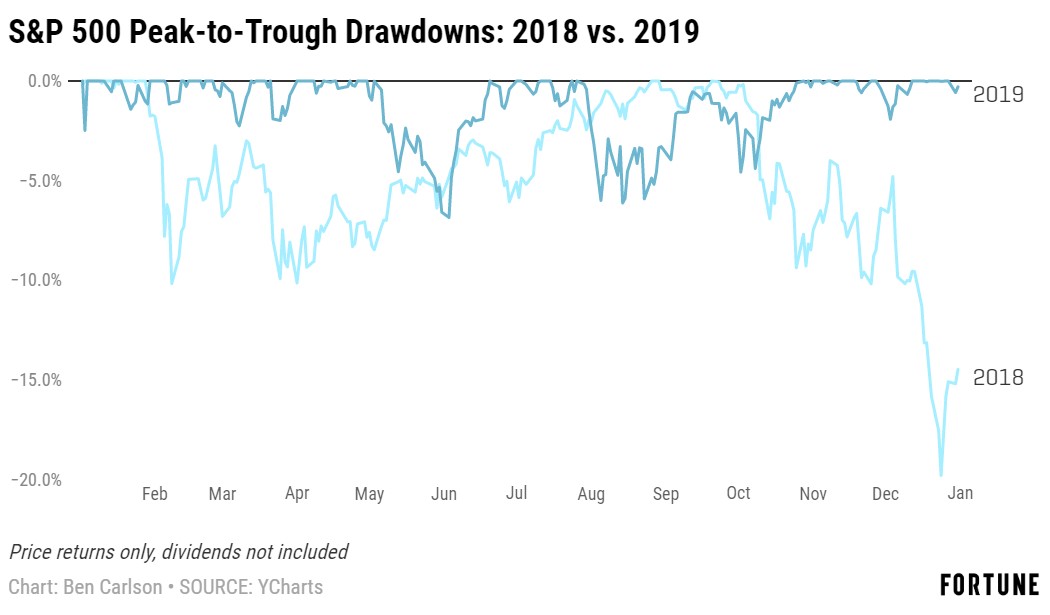
In 2018 the maximum peak-to-trough drawdown in the S&P 500 was 19.8%.
In 2019 the maximum peak-to-trough drawdown in the S&P 500 was just 6.8%.
In 2018 the S&P 500 experienced four down months and all of them were relatively large declines (-3.6%, -2.8%, -6.8% and -9.0%).
In 2019 the S&P 500 experienced just two down months over the course of the year, falling 6.3% and 1.6%, respectively in May and August.
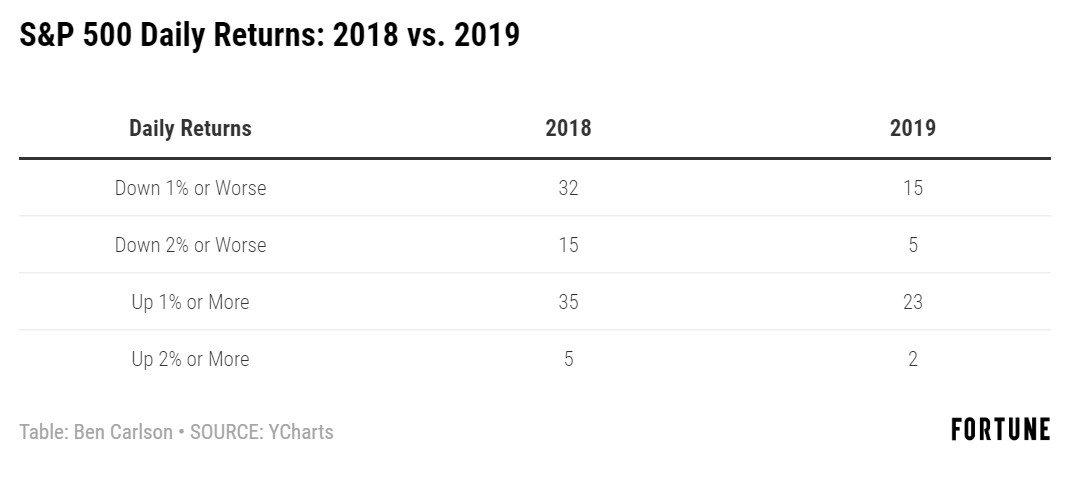
In 2018 there were 32 trading days in which the S&P 500 was down 1% or worse. Fifteen of those days saw losses extend to 2% or worse. On the flipside, the S&P was up at least 1% or more 35 days while 5 of those trading sessions saw gains of 2% or more.
In 2019 there were just 15 trading days where the S&P 500 fell 1% or worse, of which 5 of those were 2% or worse. There were 23 up 1% days in 2019 and just two 2% or better daily gains.
It’s counterintuitive but the best years in the stock market don’t typically feature huge gains day in and day out. In fact, large gains and large losses tend to cluster during volatile, down markets like we saw in 2018. The best years tend to have little volatility and many small gains.
In 2018 the Bloomberg Barclays Aggregate Bond Index outperformed the S&P 500 by nearly 4.5%.
In 2019 the S&P 500 outperformed the Bloomberg Barclays Aggregate Bond Index by more than 22%.
Looking at the averages in the stock market can help provide investors a much-needed long-term perspective. But it’s important to remember that last year’s results in the stock market have no bearing on what will happen this year.
This piece was originally published at Fortune. Re-posted here with permission.

