Imagine you’re a U.S. stock market investor at the end of 1989.
Just a few short years ago you lived through the worst one-day stock market crash in history. Despite seeing stocks fall more than 20% in a single day and more than 30% in a week, you did pretty well for yourself over the course of the decade (assuming you didn’t freak out and sell).
The S&P 500 was up nearly 400% including dividends in the 1980s, which was good enough for annual returns of more than 17% per year.
How many investors at the time would have believed the next decade would be even better?
Anyone?

No way!
When you experience above-average returns like that you should expect below-average returns to follow. That’s plain common sense.
But bull markets don’t follow the rules of common sense. They’re built on momentum, emotion and the fear of missing out.
So following 17% annual returns in the 1980s, instead of a reversion to the mean, investors were awarded even higher returns!
The S&P rose 425% during the 1990s, good enough for 18% annual returns. Investors were absolutely spoiled by the stock market for 20 years.
Or let’s assume you’re an investor in Japanese stocks during the 1970s. Basically, the same exact returns as investors in the U.S. received during the 1980s: 400% total returns or 17% and change annually.1
Not only were returns better in the 1980s in Japan, they were ridiculously better. Japanese stocks rose nearly 1200% in total or almost 29% per year. Returns were so juicy in the 1970s and 1980s in Japan, that despite horrible returns ever since then (less than 1% annually since 1990), the MSCI Japan Index is still up 9% per year since 1970.
What does this have to do with today’s markets? Well, what if we’re not in the bottom of the ninth but the top of the 5th? What if the past 10 years were unbelievable for U.S. stock market investors but the next 10 years are just as good or better?
Would I bet my life on this outcome?
Of course not. There are too many differences to count between these two periods and even if there were similarities, no two market cycles are ever exactly the same.
But what we can learn from history is that bull markets tend to run for much longer than most investors would ever think is possible. Here are S&P 500 returns broken out by various cycles going back to the late-1920s:
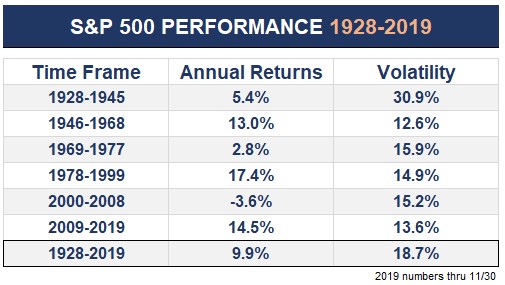
There was mean reversion following the high returns in the 1980s, it’s just that it didn’t come until the 2000s following that extended period of high returns in the 1990s. Markets are cyclical is the main takeaway here but there are some other patterns worth pointing out here:
- Periods of higher volatility and lower returns are followed by periods of lower volatility and higher returns. So maybe the returns since 2009 shouldn’t come as a surprise to investors considering how terrible that 2000-2008 time frame was?
- There were still periods of unrest, recessions, and bear markets during these long bull markets but the general move was higher for long stretches of time.
- Periods of poor returns can last for longer than most people realize as well. The Great Depression was the obvious cause of volatility during the 1930s but the 1970s was a horrible time for stock market investors as well. Those returns would look even worse if we factored in the sky-high inflation. And we all remember the lost decade to kick this century off with a thud.
- The Great Depression has single-handedly increased long-term average volatility in the market. The standard deviation in every period following WWII was lower than the overall long-term average. Just an observation.
- That pre-WWII market cycle was brutal but look at how long the ensuing bull market ran for. And the worst bear market from 1946-1968 was a loss of just 28% in 1961-1962.
- I probably did some cherry-picking with the start and end dates here but so what. The point remains that longer-term market cycles can go further and last longer than most assume would be possible.
Am I saying stocks are guaranteed to continue ripping higher for the foreseeable future? No. In fact, I’ve been lowering my own expectations for future returns for years now. But should we be surprised if the stock market continues to offer above-average returns for much longer than most investors assume is possible?
Stranger things have happened before.
It’s best to be realistic about expected returns from current levels but you also have to account for the fact that stock market outcomes exist within a wide range of possibilities.
Historically, bull markets last for much longer than most investors realize.
Further Reading:
What If Stocks Don’t Crash…
1The 1970s were a perfect example of the benefits of international diversification. While Japan was up 400%, the S&P 500 rose just 76% (5.9% annually).
