…for a while?
It’s not without precedent that the stock market can go long stretches in the absence of an enormous market crash.
Benjamin Roth was a young lawyer in Ohio during the Great Depression. He kept a diary throughout this trying period which was eventually turned into a book called The Great Depression: A Diary. The book gives an amazing first person account into what it was like to experience such economic and social upheaval.
The stock market fell in excess of 85% from the fall of 1929 through the summer of 1932. Stocks then staged a massive comeback over the ensuing 5 years or so. From the summer of 1932 through early 1937, the S&P 500 was up more than 400% or more than 42% annualized.
This recovery caused Roth to pen the following on January 2, 1937:
It seems to me that the time has come where we can formally and officially announce that the depression of 1929 has ended.
Roth made a number of predictions in the book, most of which he followed up on with later notes discussing how accurate they were. This one was followed up with a notation on July 19, 1939:
You were wrong. A new depression started Sept. 1937 and is still with us.
The setback in 1937 had to be a vicious stomach punch for those who thought the worst of the depression was finally behind them. The 1937 episode saw GDP contract more than 18% while stocks fell nearly 55%.
Can you really blame people from this generation for basically giving up on the stock market following this period?
But a funny thing happened over the next few decades. Stocks didn’t really crash again until the mid-1970s. The following table shows every double-digit correction and bear market from 1938 through the end of 1972:
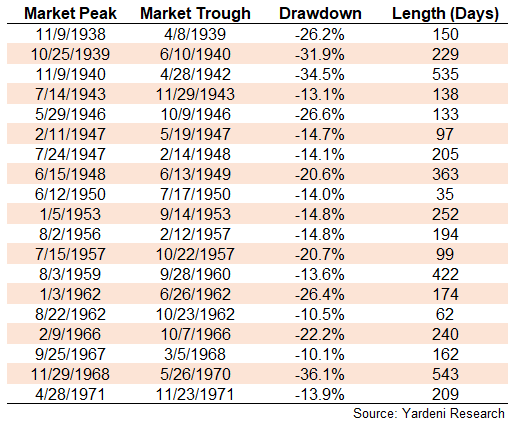
The average double-digit decline in this 35 year period was -19.9% and lasted 223 days from peak to trough. If we were to look at only the bear markets (losses of 20% or worse) the average drop was -27.2%, lasting 274 days from top to bottom.
These types of losses are never easy to stomach but they don’t come close to the gut-wrenching losses of the 1930s. They were all fairly run-of-the-mill corrections and bear markets, even throughout World War II and the nasty recession that followed it in 1945.
The 1950s turned out to be the best-performing decade of the modern era, returning more than 19% annually, outpacing even the 1980s and 1990s (17% and 18%, respectively).
This period of relative calm in the markets was followed by a brutal bear market in the 1970s which saw stocks get chopped in half. Inflationary pressures made things even worse than that. Nominal returns in the 1970s were nearly 6% per year but after accounting for inflation, they were down over 1.5% annually on a real basis.
And of course, everyone is well aware of the fact that stocks have seen two 50% plus crashes since the turn of the century. But in-between the 1973-74 crash and the dot-com flameout that began in 2000, there was another period of relative calm in stocks:
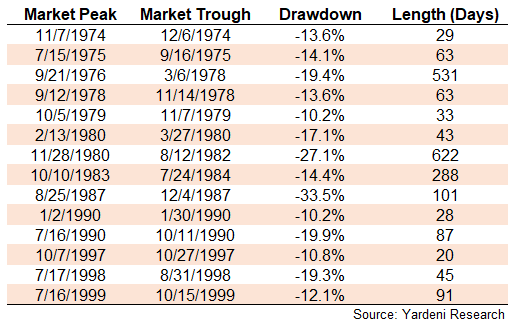
Over this 25 year period, the average double-digit drop in stocks was just -16.8%, lasting an average of 146 days in total.
The crashes in the 1930s and the early part of this century clustered together. Both economic and stock market downturns surely left scars for all involved. But the aftermath of those rare events saw markets go many years without experiencing an enormous crash.1
Many investors seem to assume the next downturn will be another scorched earth scenario. That is always possible. But if history is any guide, it’s also possible that scenario could be a long time coming.
The stock market will surely crash at some point in the future because that’s part of how markets function. But predicting when that crash will occur is not so easy.
Source:
The Great Depression: A Diary
Further Reading:
10 Things You May Not Know About the Great Depression
1I guess you could talk me into calling Black Monday in 1987 an enormous crash but stocks were still up 5% or so on the year following that fateful day.
