Recent stock market performance is odd in that 2019 has gone gangbusters but since the start of 2018, stocks have basically gone nowhere. The obvious culprit here is the fact that stocks fell roughly 20% in the 4th quarter of 2018.
Here’s a Fortune piece I wrote to put this performance into context.
*******
The S&P 500 closed at 2,839 on January 25, 2018. On Monday [August 26], the S&P closed just shy of 2,886. That’s just 1.6% higher. So not including the dividends paid out in this time, the stock market has basically gone nowhere for more than a year-and-a-half.
Coupled with the recent volatility in the markets over the past year or so, the fact that markets have done nothing for some 18 months can make some investors uncomfortable. My advice: get over it. This is nothing in the grand scheme of things and it’s not rare.
Going back to 1928, using daily data on the S&P 500 index, I looked at all rolling 18-month periods. The S&P was either flat or down more than 27% of the time. So nearly one-third of the time over the past 90-plus years, stocks have gone nowhere or in reverse for lengthy stretches of time.
And while stocks have been in neutral for while the U.S. stock market has been kind to investors if you’re willing to zoom out a little. Over the past three years, the S&P 500 is still up more than 40% in total. Despite widespread worries about the trade war, yield curve inversions, and the possibility of a recession, the S&P 500 is up more than 16% in 2019 alone.
The recent 6% pullback we experienced in recent weeks is less than half the average intra-year drawdown in the S&P 500. Going back to 1950, the average intra-year peak-to-trough drawdown has been nearly 14%. Double-digit losses are the norm even during good years in the stock market.
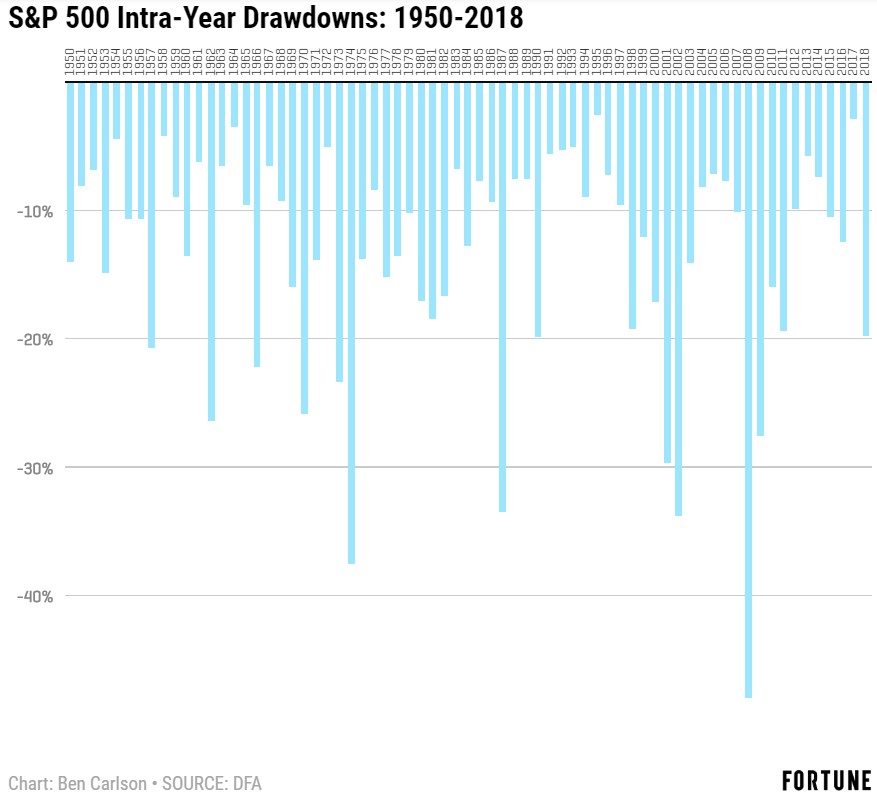
Although 37 of the past 69 years have experienced a double-digit drawdown at some point, only 15 of those instances saw the market end the year in negative territory. That means more than 60% of the time when stocks fell 10% or more during the year, they’ve still finished the year with gains. In fact, this exact scenario has occurred five times since 2009 alone (2009, 2010, 2011, 2015 and 2016).
Market downturns don’t adhere to a strict schedule so here are each of the double-digit corrections in the S&P 500 since the financial crisis:
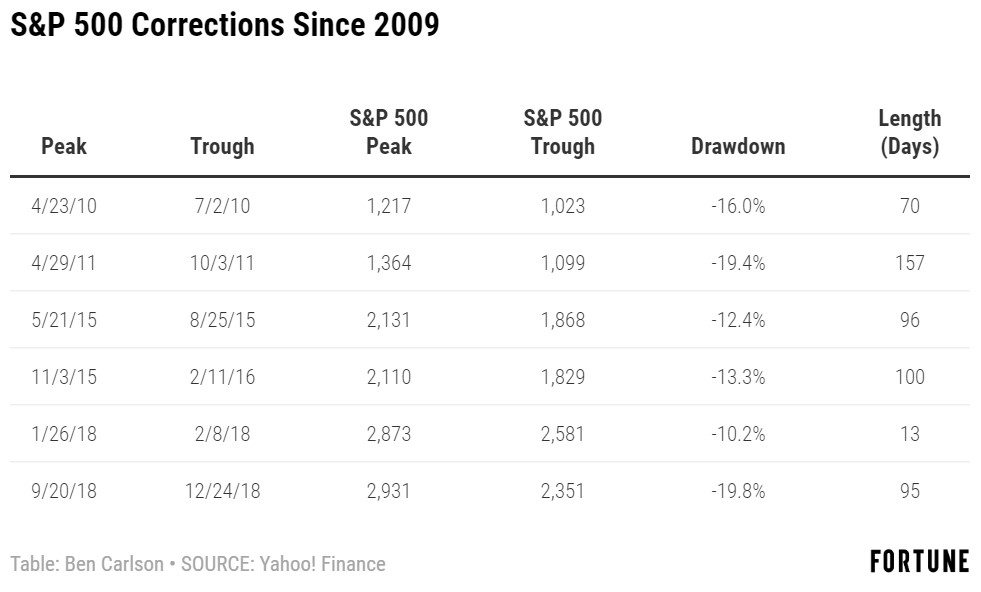
Corrections never feel healthy as they’re going on but these have been fairly run-of-the-mill when you look at how long it took the market to recover. The average recovery period to go from peak-to-trough-back to peak since 2010 has been roughly 9 months. This is hardly enough time for investors to truly panic.
These are all minor corrections by historical standards when compared to the worst bear markets of the past 50 years or so. The worst bear markets since WWII in the S&P 500 occurred in 1973-1974, 2000-2002, and 2007-2009, all of which saw the market get cut in half or worse. The average time it took to recover new all-time highs in these three bear markets was almost 81 months.
So the current market environment has been child’s play by historical standards. Volatility is nothing new. Neither are losses. This is how the stock market has always functioned. It hasn’t always been easy to invest in stocks over the past decade or so because there have been plenty of naysayers for the entire run-up in prices. But investors have yet to experience a long-lasting period of volatility since the financial crisis.
Investors have had it pretty good for some time now. It will be interesting to see if this period will lead to a sense of complacency when the next prolonged bout of turbulence does hit. In the immortal words of the Bachman-Turner Overdrive: “You ain’t seen nothin’ yet.”
This piece was originally published at Fortune. Re-posted here with permission.

