A study from BNP Paribas showed close to 60% of respondents felt owning a home was one of the top ingredients in the American Dream. Increasingly, this dream is out of reach for many young people.
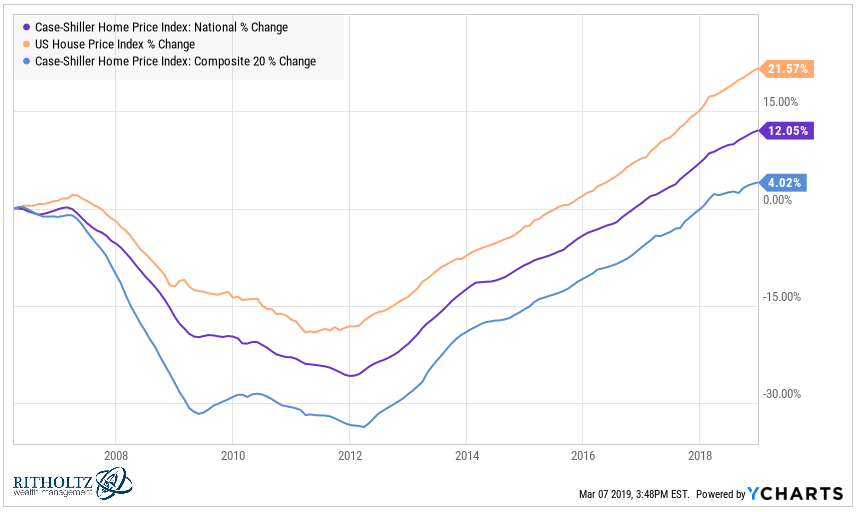
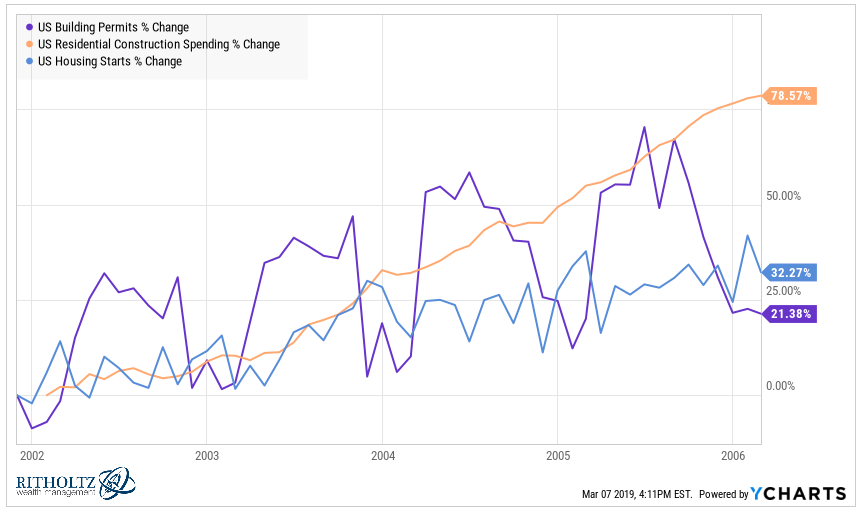
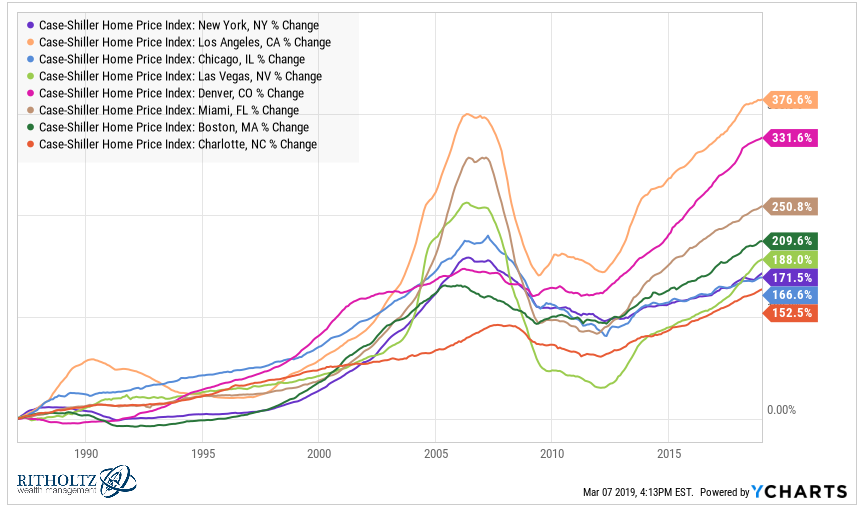
One of the many reasons so many millennials are unhappy with their financial situation is that buying a house has become so expensive in many parts of the country. Here’s how prices nationwide have performed since bottoming out in 2012 following the crisis:
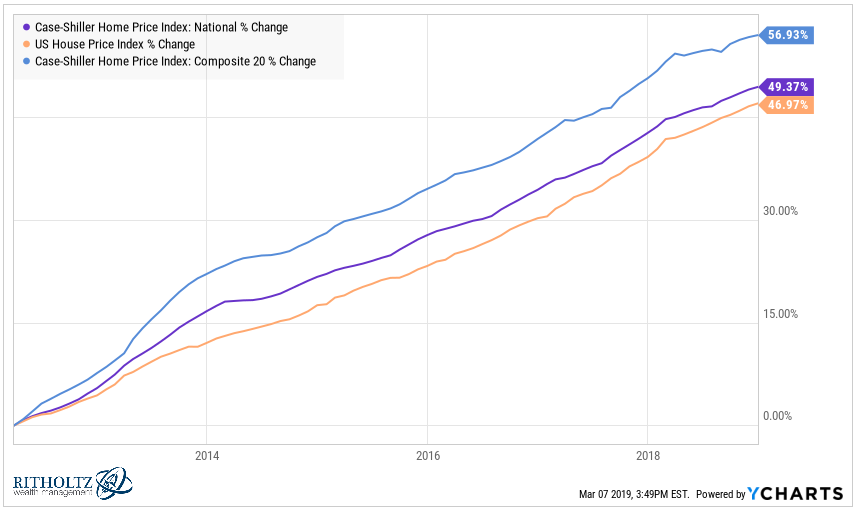
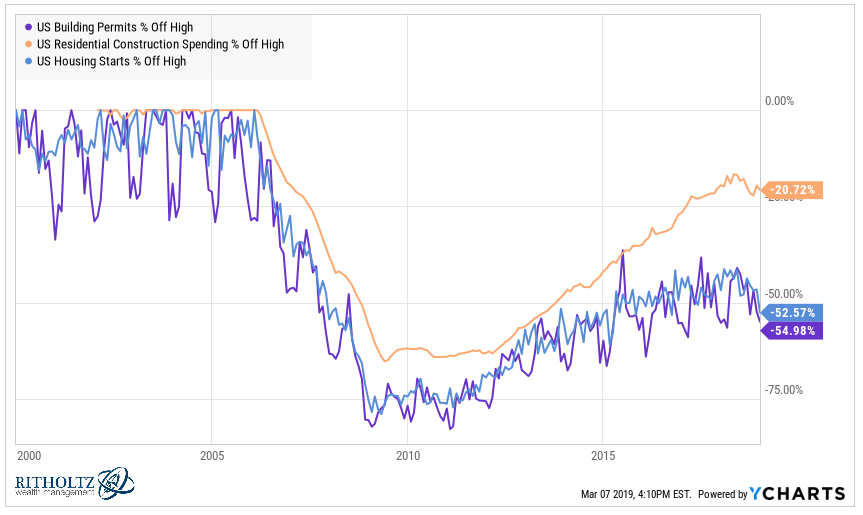
Those numbers are from the bottom. Now let’s see how they’ve done since the top in 2006:
Not nearly as impressive. In fact, since the housing market peaked in 2006, residential real estate as a group has underperformed both inflation and average hourly earnings:
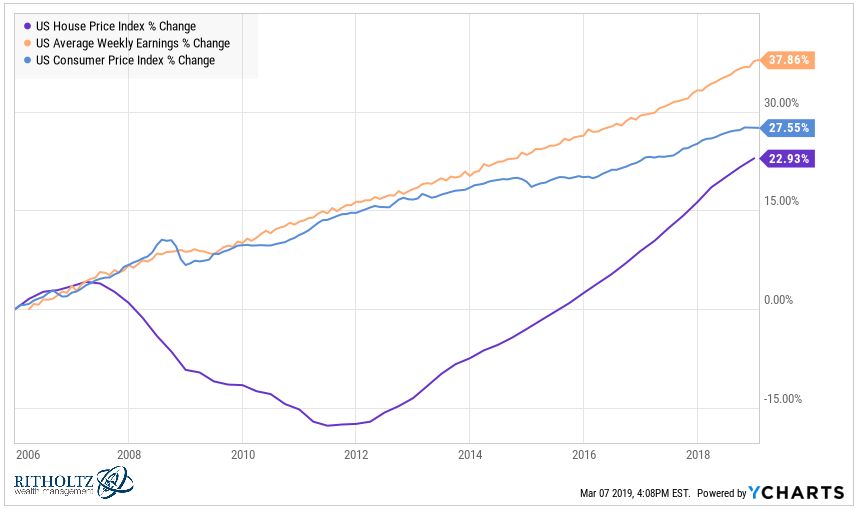
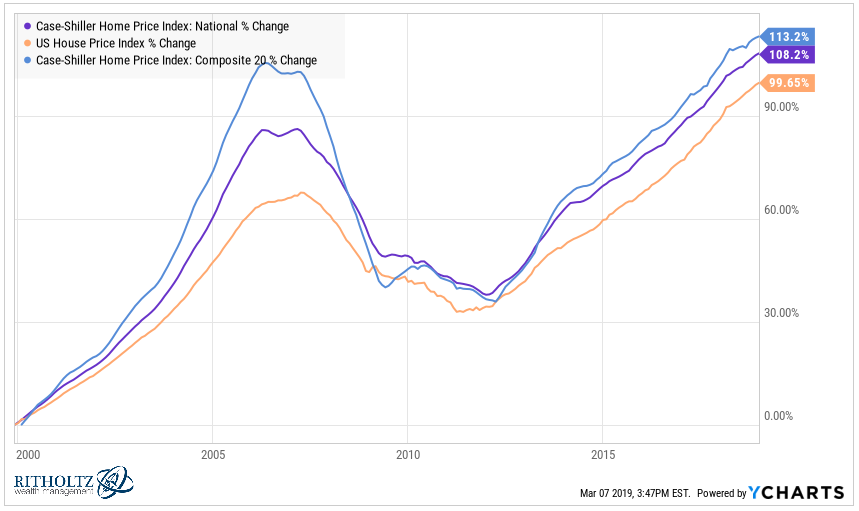
Looking at returns from peaks and valleys can be dangerous because you can always torture the data to make it say what you want when playing with dates like this. But the longer term picture does show that even with the financial crisis, housing is up a lot this century:
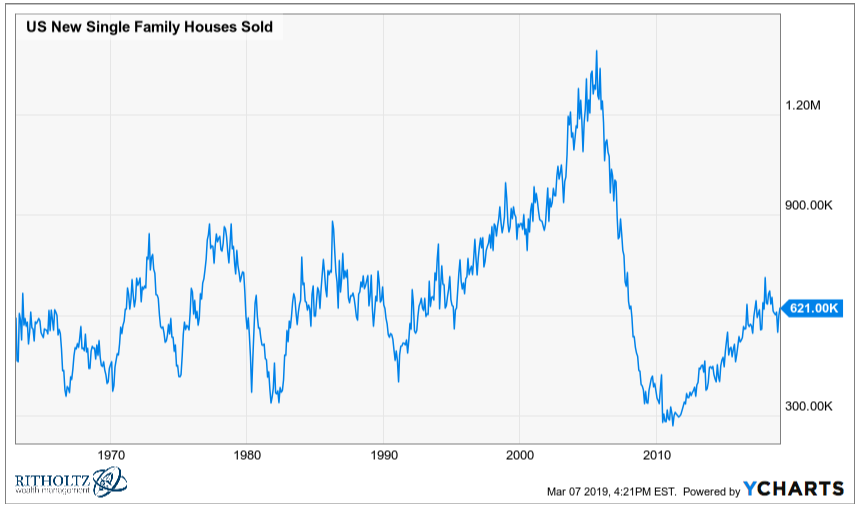
One of the problems when you mix human nature with financial markets is that we tend to take things way too far in either direction at the extremes. During the housing boom there were too many houses being built to sustain the underlying fundamentals at the time:
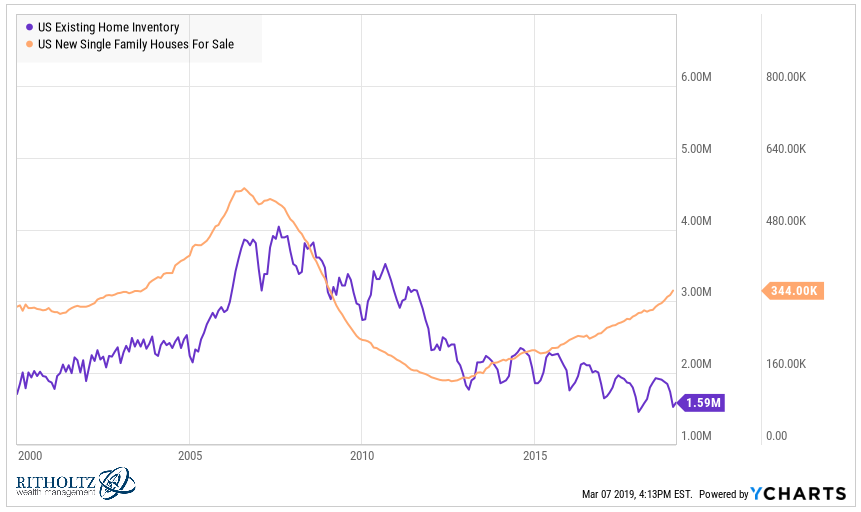
The other side of that overbuild was a severe dropoff in new homes in the aftermath of the housing bubble:
This is probably one of the biggest hurdles for young people who would like to settle down. The supply is constrained. Anecdotally, I’ve talked with a handful of local West Michigan builders who more or less had to close up shop after the bubble burst and it took them years to dip their toe back in the water.
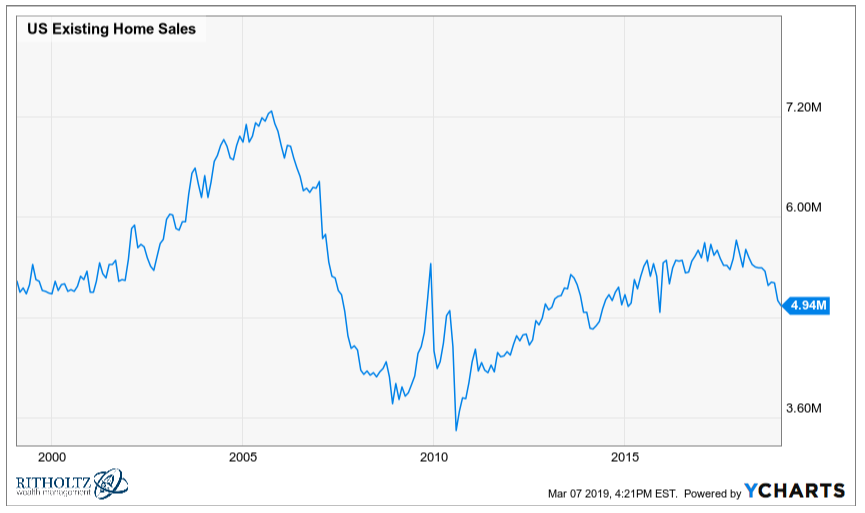
New single-family houses for sale are finally on the rise but are still barely at the levels seen in the early-2000s while existing home inventories continue to fall:
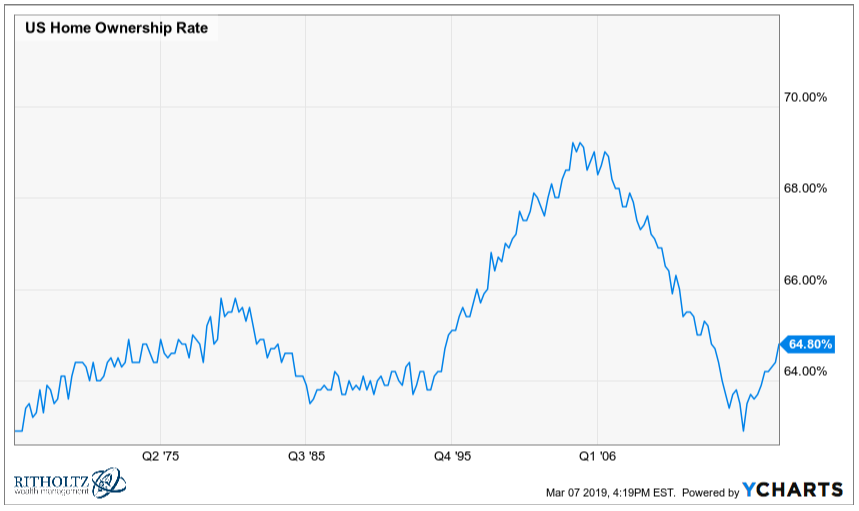
The housing bubble becomes apparent when you look at any data related to owning or building. The U.S. homeownership rate rose for more than a decade before falling back to earth after the bubble deflated. Only recently has there been an uptick in this measure:
The massive drop in new single-family houses sold is astonishing in both its depth and speed:
Existing home sales took it on the chin as well but not nearly in the same magnitude as new homes:
Location is everything in real estate so your experience is shaped by the market you’re personally dealing with. Many of the biggest markets have seen the biggest gains over the past few decades, making it increasingly unaffordable for those just starting out:
It is worth noting, however, that a handful of these markets have yet to reach their prior peaks seen in the bubble:
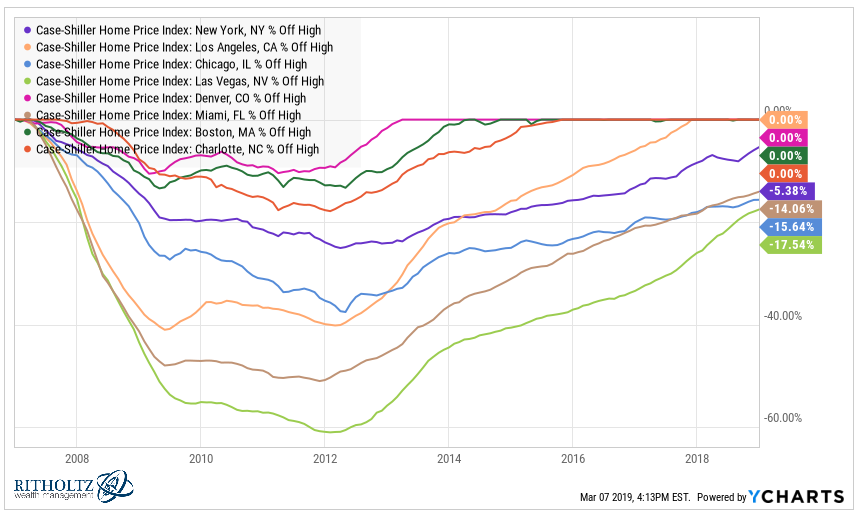
Las Vegas, Chicago, Miami, and New York City are all still under their peak levels from 2006.
There are other less expensive options for young people when it comes to buying a house but there are fewer opportunities available when it comes to job prospects when you look outside the biggest cities.
As always, life is full of trade-offs and the real estate market is no different.
Source:
YCharts
Further Reading:
How Often Can You Buy the Dip in Housing?
Now here’s what I’ve been reading lately:
- The breakthrough (Reformed Broker)
- I retired at 38. Here’s what I didn’t expect (The Cut)
- Getting busy on the proof (Above the Market)
- What happens after you win? (Irrelevant Investor)
- Home buyers don’t move out of necessity anymore (The Basis Point)
- Using flexible spending to achieve your financial goals (Alpha Architect)
- Follow the money to solve a bank heist (KC ROI)
