The Credit Suisse 2019 Global Investments Returns Yearbook is a treasure trove of long-term financial market return data. This table on the (very) long-term real returns for stocks and bonds tells a good story:
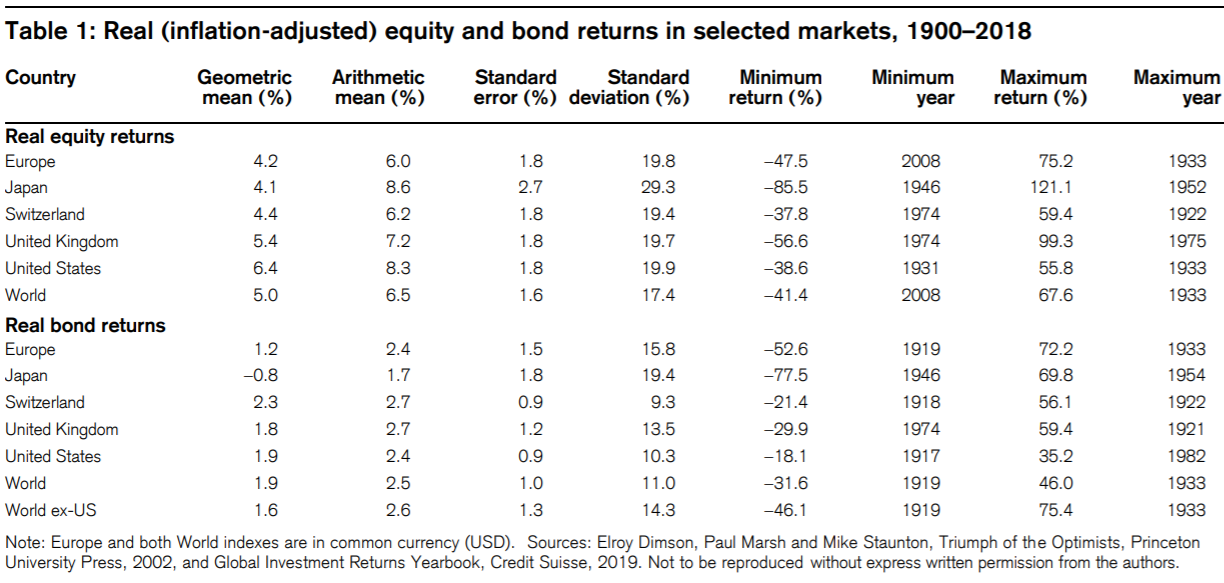
It shows how being an equity owner typically works out better than being a lender over the long-term. It shows financial assets can be highly volatile and highly risky in any given year. And it shows that while market crashes are the biggest short-term risk in stocks, the long-term risk in bonds is inflation chipping away at your purchasing power.
Obviously, an investment time horizon of almost 120 years doesn’t do us much good in the real world because no one has that much time for their investments (until Silicon Valley billionaires figure out that whole immortality thing).
To get a better sense of how often different time horizons actually come anywhere close to these long-term averages, I looked at the long-term real returns for stocks and bonds in the U.S. going back to the 1920s.
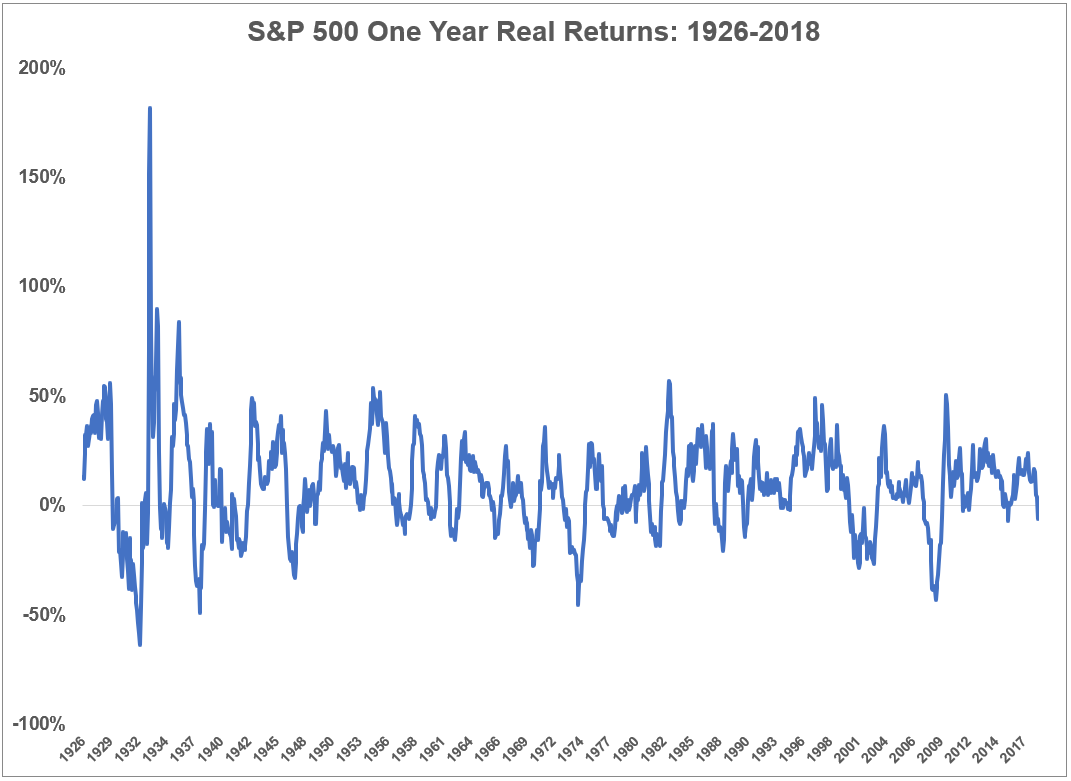
From 1926-2018, the S&P 500 returned 6.9% annually after inflation. Over that same period, 5 year treasuries did 2.1% real on an annualized basis.
Next I looked at rolling monthly returns over various time horizons to calculate how often stock and bond performance were within a range of plus or minus 1% of the long-term averages. So for stocks it was a range of 5.9% to 7.9% and for bonds it was a range of 1.1% to 3.1%.
For example, over a one year period, the returns for stocks were within this range just 4.4% of the time.1
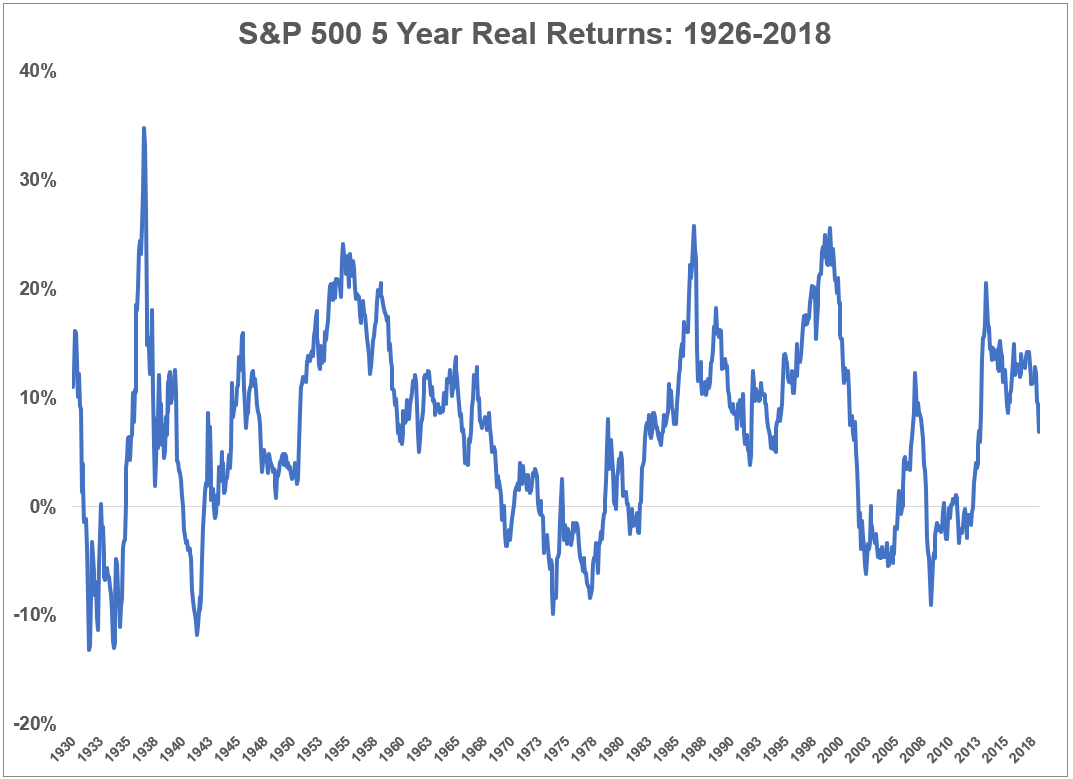
Over five years the performance was in this band just 7.9% of the time:
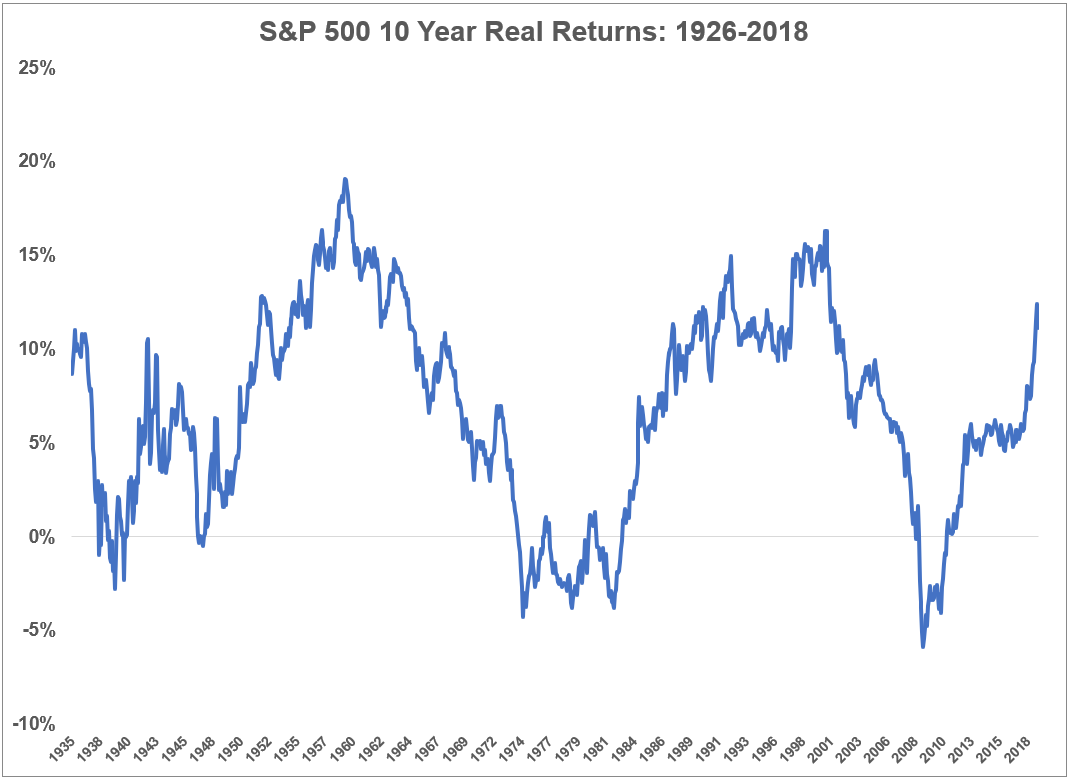
Even going out ten years only got us to 12.1% of occurrences:
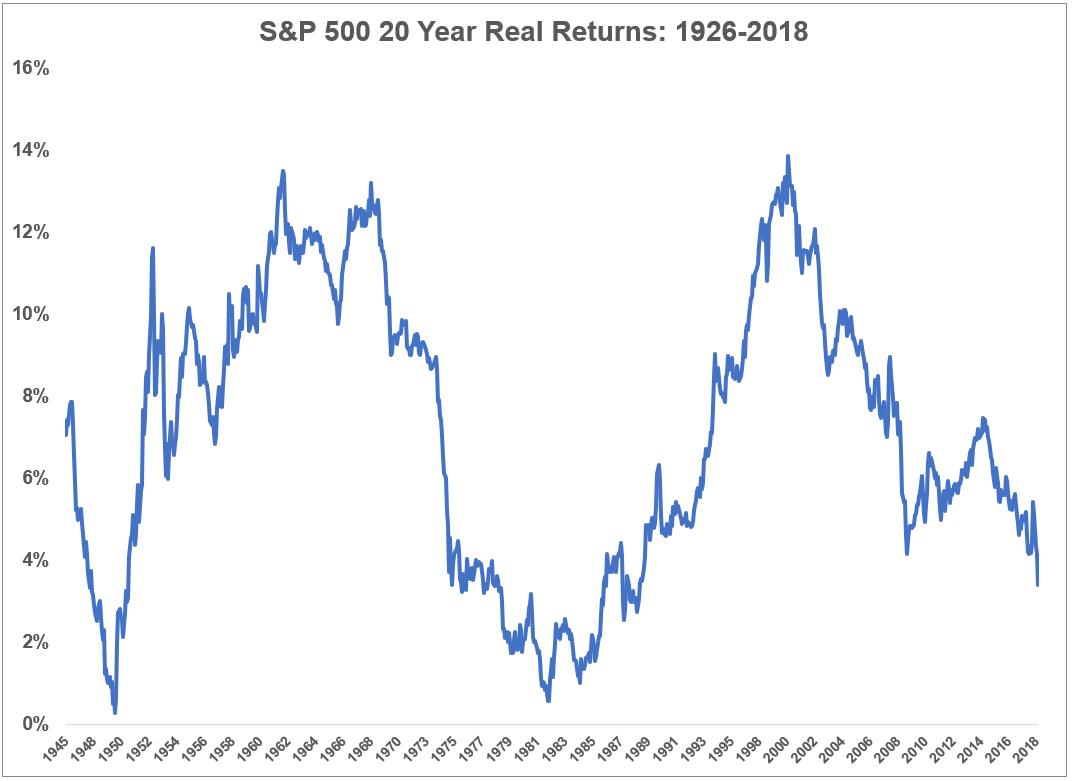
Extending the time horizons to twenty years barely nudged the numbers up to 13.9%:
It wasn’t until you go out to thirty years that you even get close to half of the periods (42.4%) showing up within the range of the long-term averages:
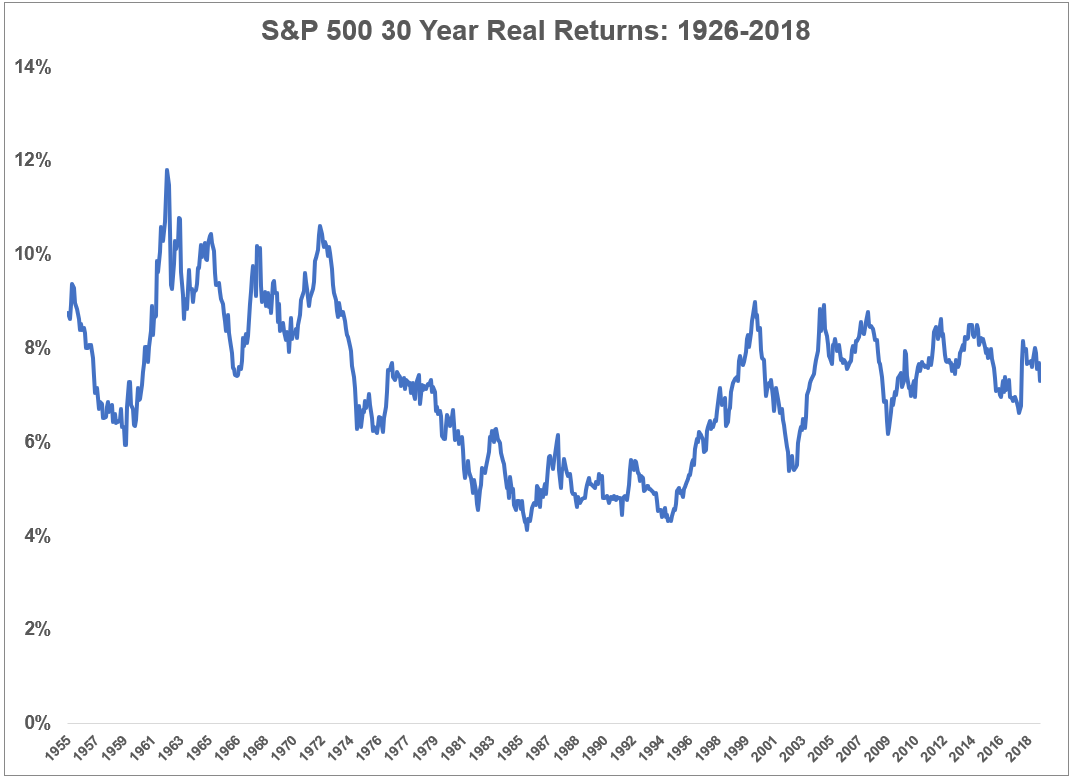
It makes sense over 1, 5, and even 10 year periods that average stock market returns would fluctuate widely. But even extending your time horizon a few decades doesn’t necessarily show a high probability of experiencing average returns.
Bonds weren’t much more predictable. Here’s a table summarizing the stock data from these charts along with the same information for bonds:
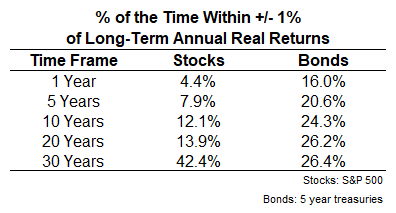
Bonds don’t provide anywhere close to the levels of volatility you can expect to see in stocks so the fact that these numbers are so low for fixed income has more to do with the inflation component than the nominal bond market returns. Either way, even the bond market won’t be as predictable as some would imagine when you take into account returns on a real basis.
Looking at the very long-term returns on stocks and bonds can be helpful because it provides a strong baseline for the relationship between risk and reward in the basic asset classes.
Average returns can help set expectations but the actual experience for most investors is anything but average. Even extending your time horizon to double digits doesn’t provide much clarity in terms of actual results versus the long-term averages.
Some investors will be lucky but the majority of us should plan for almost anything but average.
Averages are clean but actual results are messy.
Further Reading:
The Worst Entry Point in Stock Market History?
1I used rolling monthly inflation-adjusted returns for all of the data here (source: DFA).
