U.S. stocks were up double-digits well into 2018 and sailing along nicely until a funny thing happened — they stopped going up and went the opposite direction as they are wont to do.
The Vanguard Total Stock Market ETF (VTI) is now down around 20 basis points on the year.
Not only have stocks struggled as of late, but with rising interest rates for most of the year that means bonds are down too.
The iShares Aggregate Bond ETF (AGG) is down 2% this year.
The only one of the three major asset classes that’s up this year is actually cash (or cash equivalents for those who worry about labels).
The SPDR 1-3 Month T-Bill ETF (BIL) is actually up 1.5% this year now that the Fed has decided to stop punishing savers.
Granted, cash is not exactly destroying stocks and bonds by any means, but this scenario is rather rare.
I looked at the S&P 500, 5-year treasuries and one-month t-bills going back to 1926 to see how often this has been the case in a given calendar year:
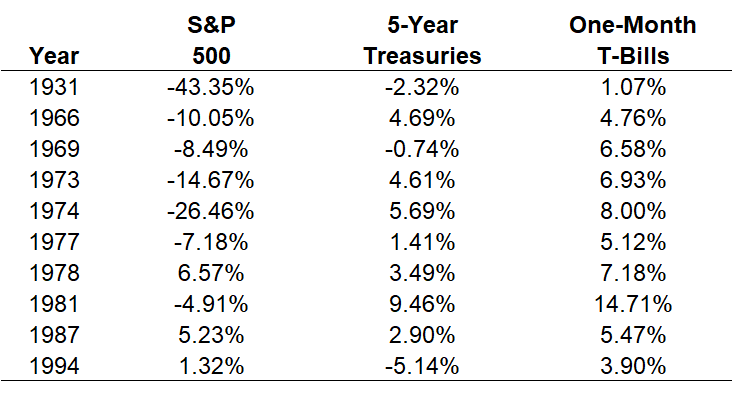
Cash hasn’t outperformed both stocks and bonds over the course of a year since 1994. It’s only happened 10 times in 92 years. The only time cash was positive while both stocks and bonds were negative was in 1969 and 1931.
So it’s rare but not out of the question. The majority of the time it occurred during much higher interest rate regimes seen in the late-1960s, 1970s, and 1980s.
If you look at what’s been happening in the markets lately it makes sense cash has outperformed the other asset classes. Interest rates have risen. Stocks are in correction territory. The yield curve is close to inverting. Short-duration fixed income should do relatively well in that environment.
But it’s important to remember that over a 12-month time frame nothing is guaranteed in risk assets. This is cash minus stocks over rolling 12-month periods going back to 1926:
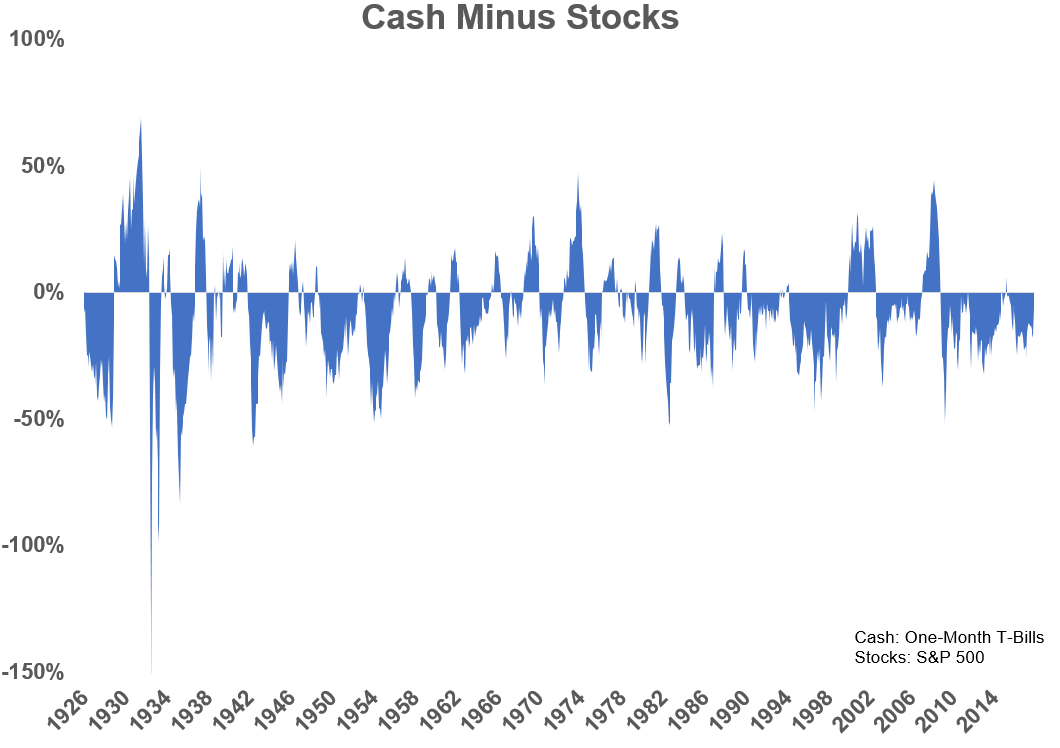
Stocks have outperformed cash in 70% of all rolling 12-month periods, meaning cash has outperformed 30% of the time. This is driven mostly by the fact that stocks are up roughly 70% of the time on a one-year basis but this chart does a good job of showing how cyclical these things can be.
Now here’s cash minus bonds:
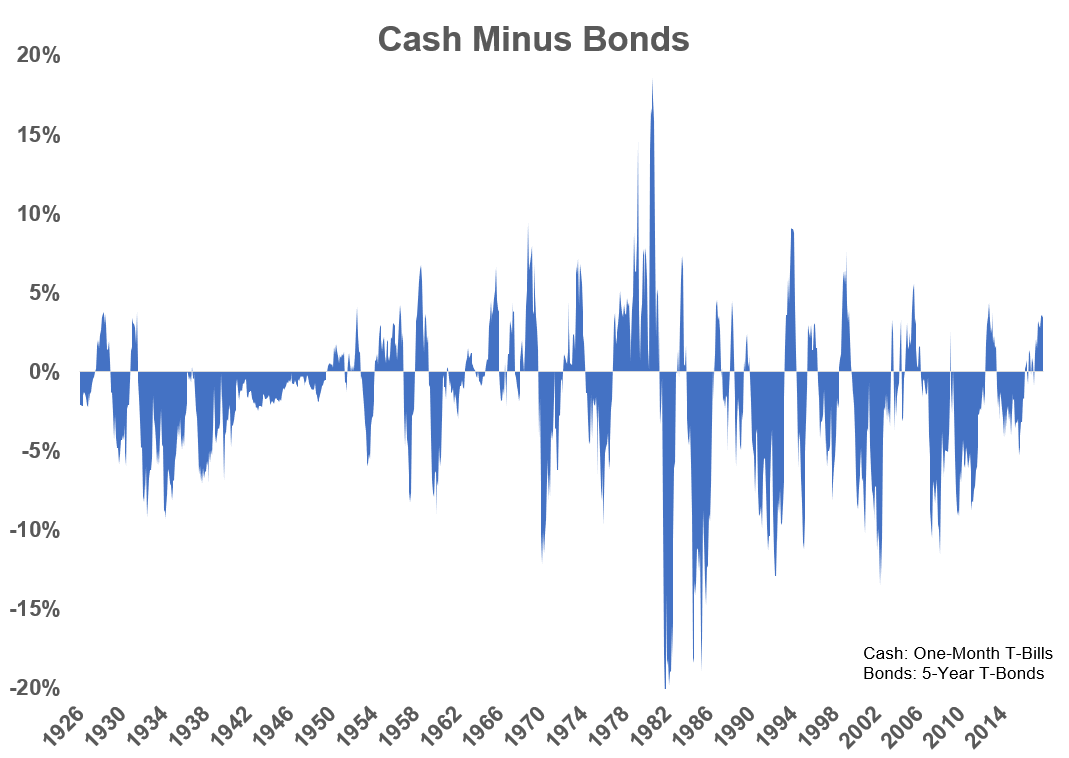
The highs and lows aren’t as drastic when dealing with bonds but the plus/minus results are similar. Bonds have outperformed cash 66% of the time while cash has had the upper hand 34% of rolling 12-month periods.
It’s important to remember these relationships when the scary headlines begin appearing after cash outperforms.
This doesn’t mean diversification is dead or broken, just that nothing works all the time in the markets.
This doesn’t mean risk is not being rewarded in the markets, just that risk still exists in the short-term when investing in long-term assets.
Further Reading:
Stocks Are More Similar to Bonds Than You Think

