Stocks are getting massacred. Absolutely slaughtered. Pounded into submission. Markets are in turmoil. Investors are panicked, shellshocked and dare I say, jittery.
These are some of the words and phrases you hear bandied about when stocks are in the midst of a freefall.
Fun times.
Let’s take a look at the numbers to see how bad things have been in various segments of the stock market this year to get a sense of the damage inflicted.
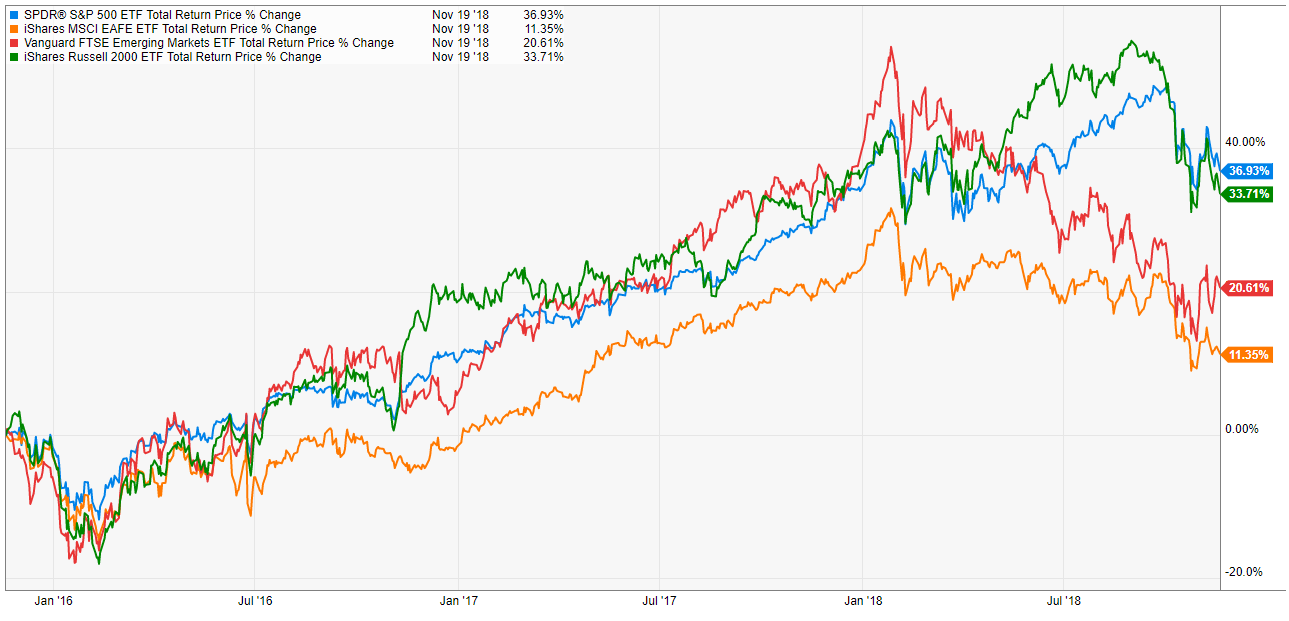
The S&P 500 is in the shallowest drawdown of the main markets, mostly because foreign developed and emerging markets never regained their losses suffered in the correction in January and February earlier this year:1
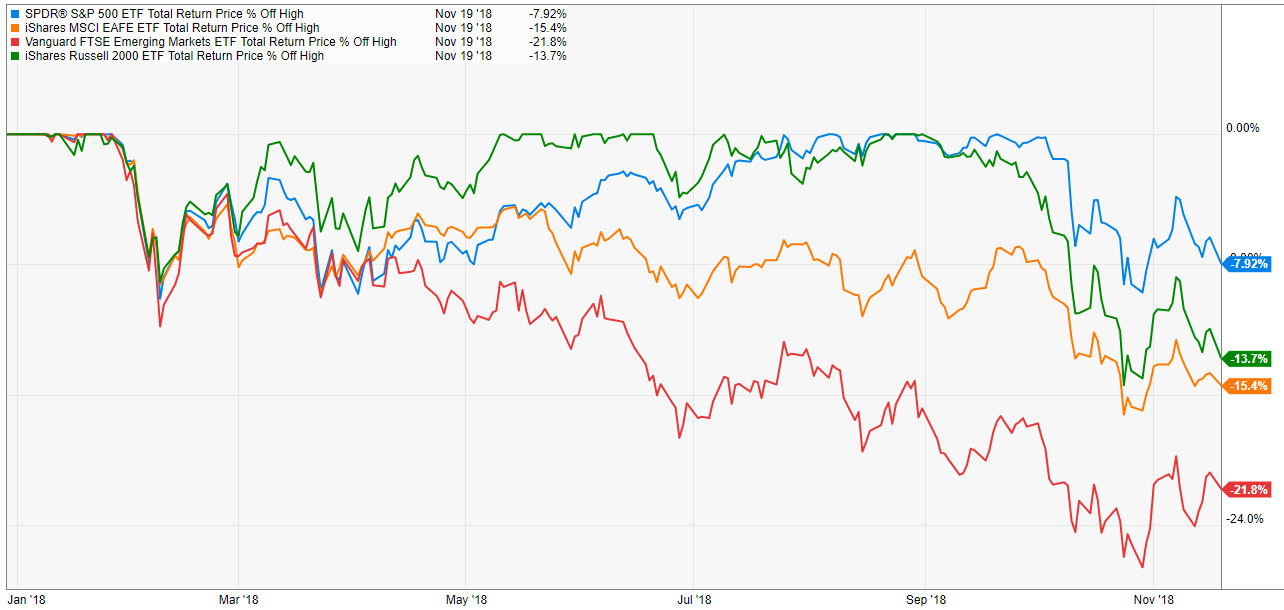
Emerging markets are in a bear market but that’s nothing new for developing country stocks.
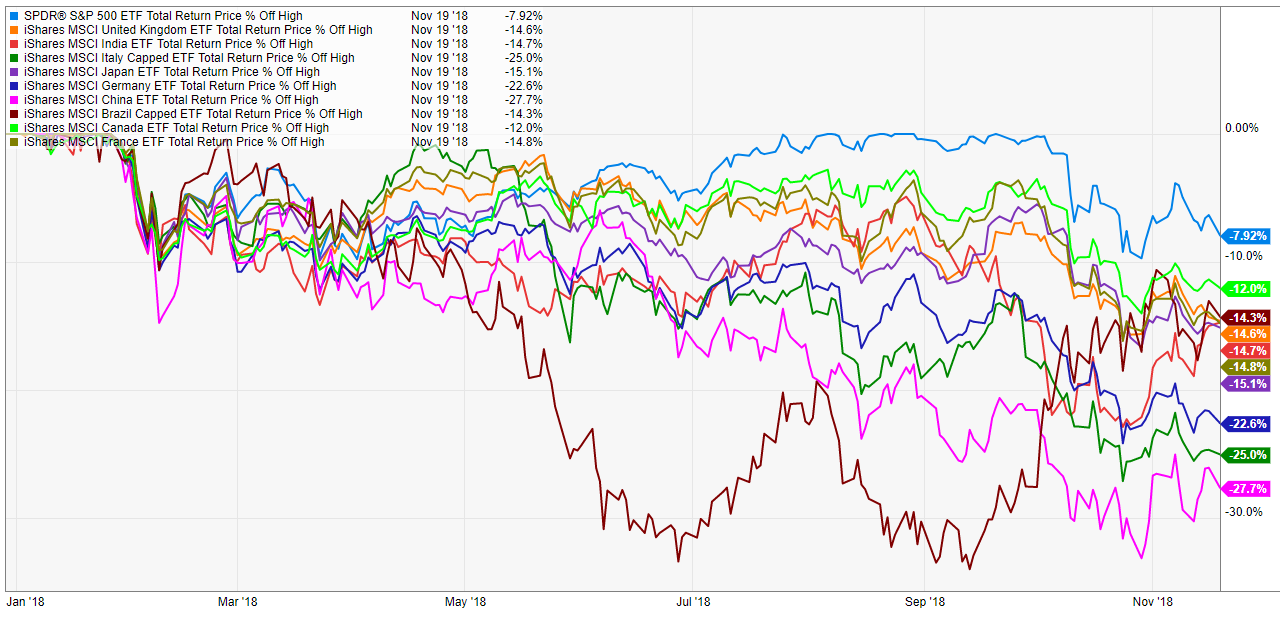
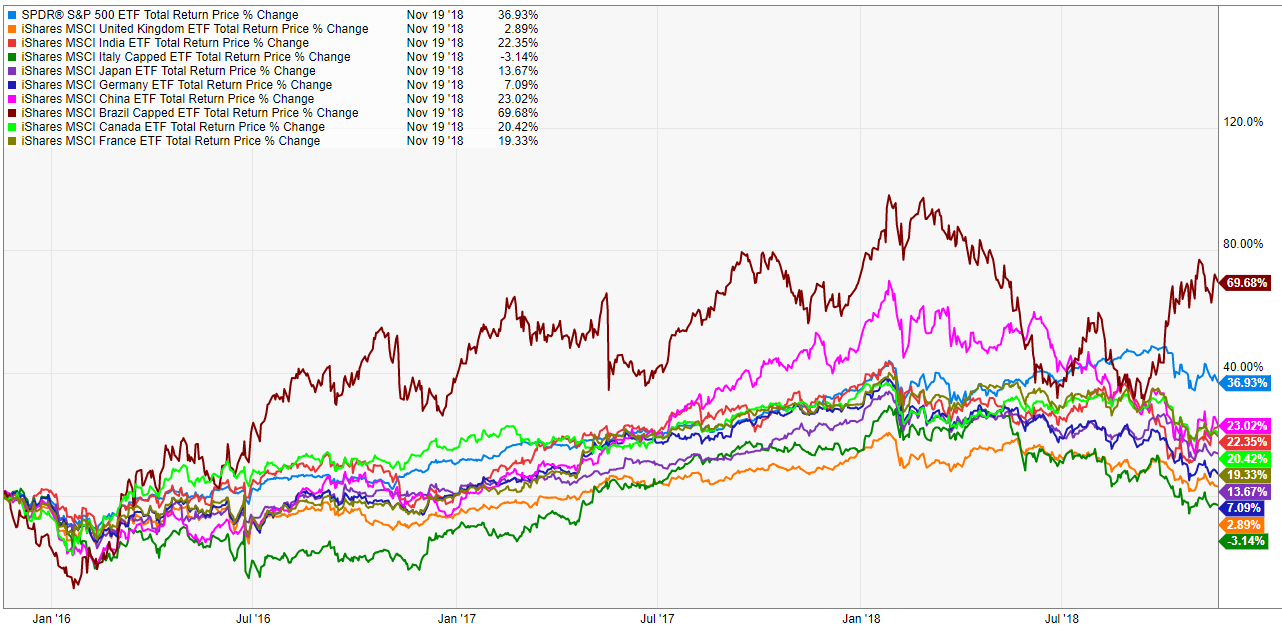
If we look at the 10 largest economies in the world, you can see that China has seen the worst losses this year in terms of the biggest drawdown from this year’s high watermark, while the S&P 500 is the only market that’s not down double-digits from its highs (yet):
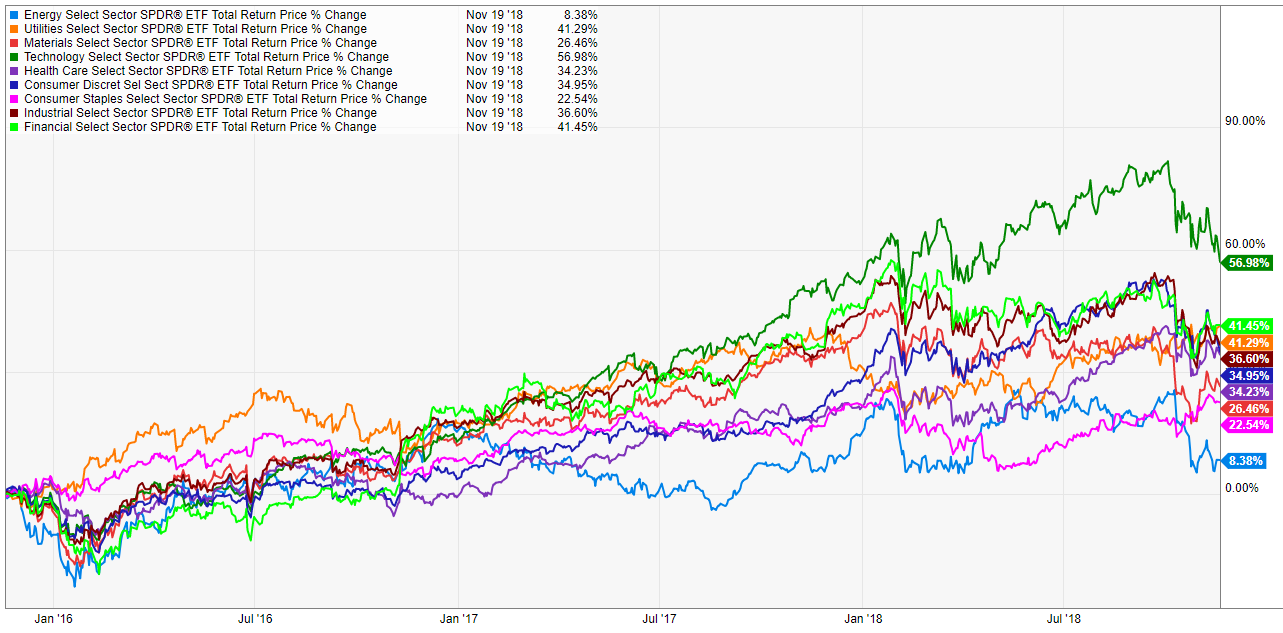
It’s possible one of the reasons U.S. stock markets have been so resilient is because our economy is more diversified than most. You can get a better sense of this by looking at the dispersion in sector drawdowns within the S&P:
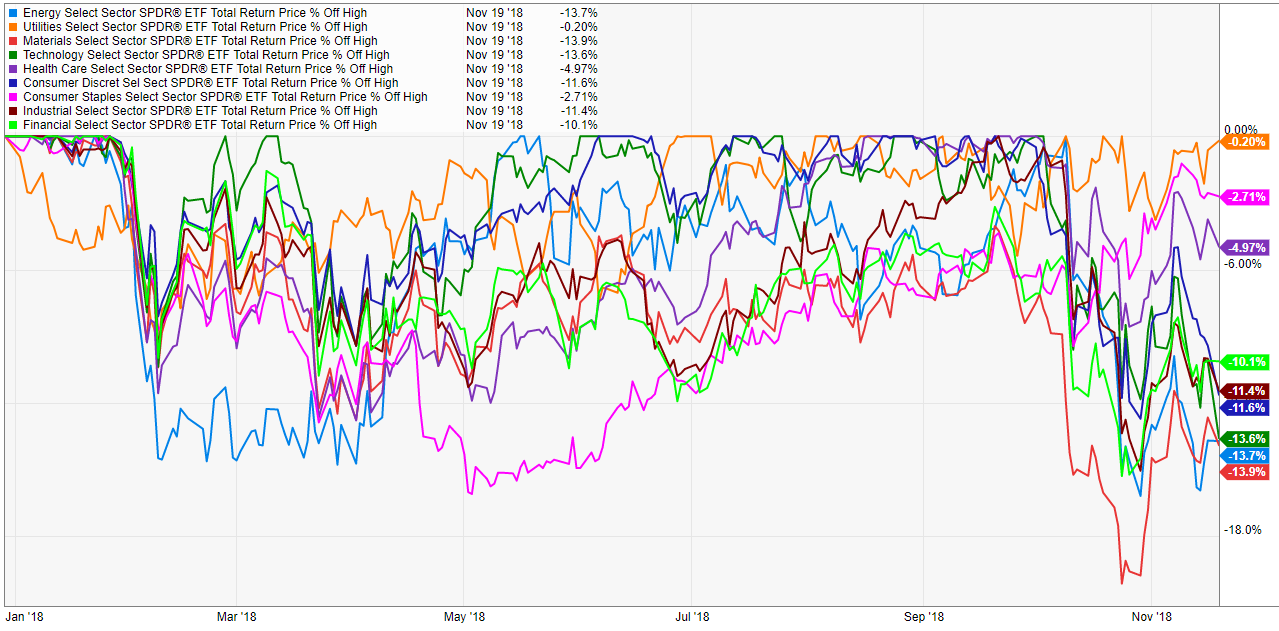
Tech, materials, and energy are all big losers but those losses are somewhat offset by the smaller drawdowns in utilities, health care, and consumer staples.
Things get really ugly when we look at the tech sector:2
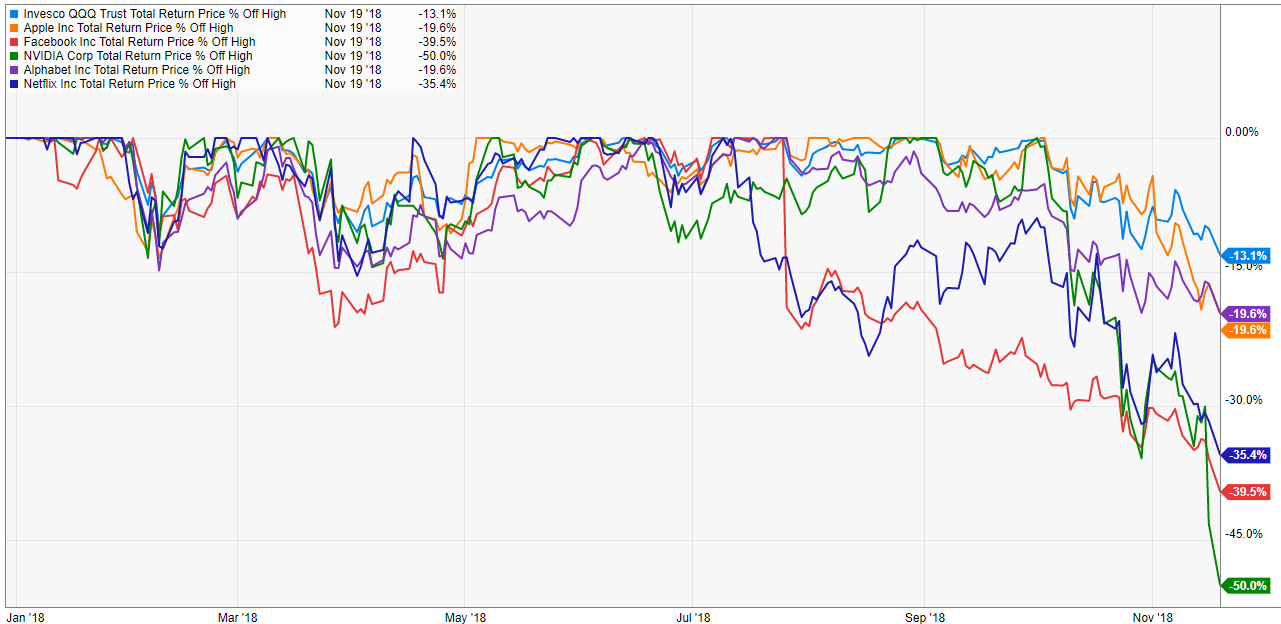
Hello NVIDIA! It makes sense that these stocks have seen much larger drawdowns than the overall market because they’ve also seen much larger gains in recent years (hold that thought).
It can also be instructive to look at the different risk factors when markets are falling to see which types of stocks are taking it on the chin the most:
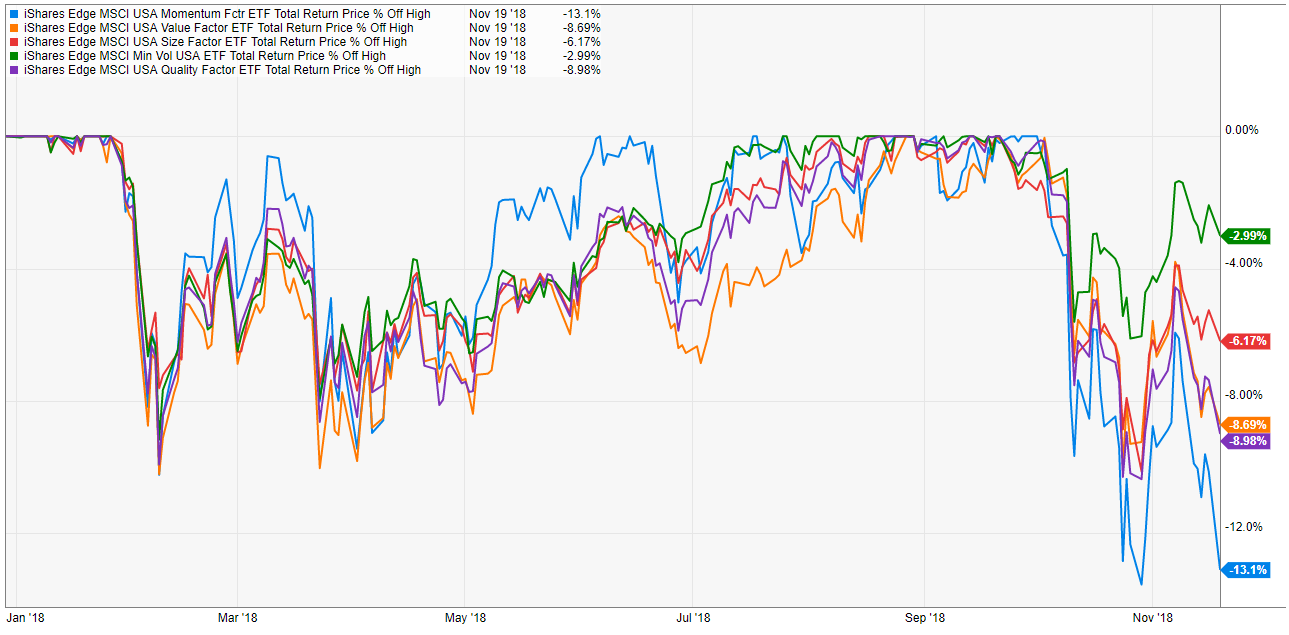
Low vol is living up to its name by providing some support during a falling market while momentum stocks are finally coming back to earth.
I hate to be that guy that does the perspective thing when markets are falling but…
Who am I kidding? I love being the perspective guy when markets are falling.
Yes, stocks around the globe are in the midst of a nasty drawdown but the major markets have seen healthy gains over the past three years, even after accounting for the recent downturn:
It’s amazing how U.S. markets remain in the shallowest drawdown despite outperforming the majority of the global stock markets by a wide margin over the past 10 years or so. Every one of the economic powers still has decent gains over the past three years save for Italy while some may be surprised to see such large gains in Brazil:
The same holds true for S&P 500 sectors, although it can’t be much fun to be in the energy sector these days. Energy has by far the smallest gains in this time frame but has a similar drawdown in 2018 to tech stocks, which have handily outperformed every other sector for some time now:
NVIDIA has gotten chopped in half in a relatively short period of time but look at how big the gains are in this stock over the past three years:
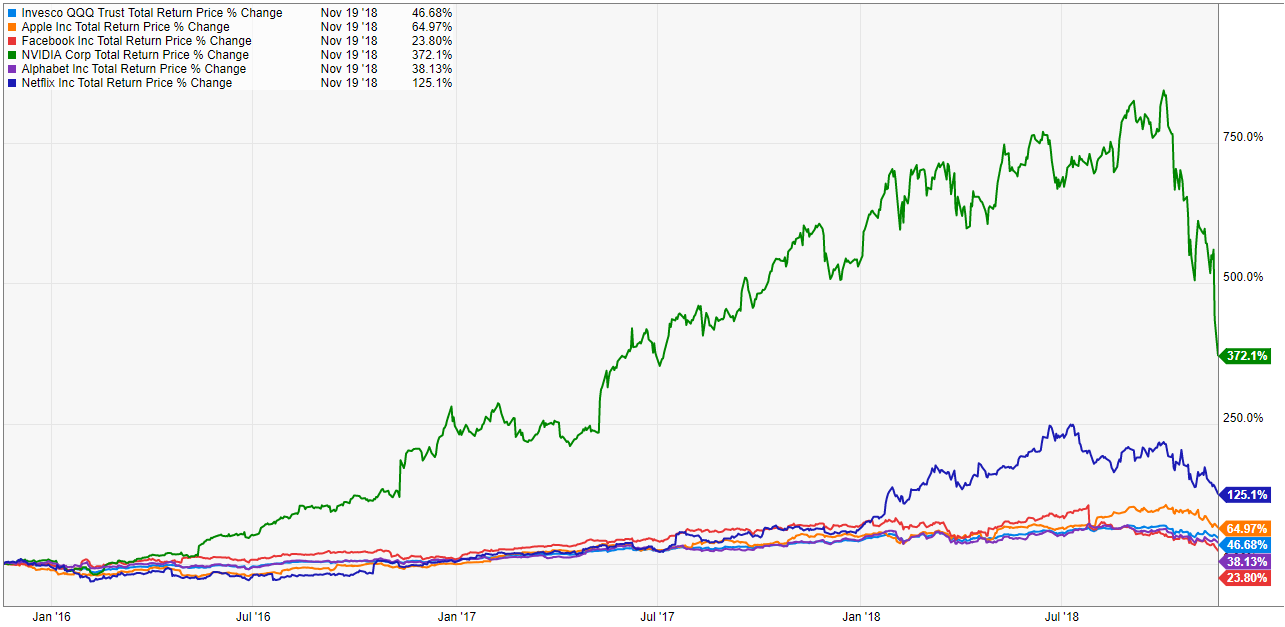
It’s still up nearly 400% despite falling by 50% this year! Every other stock on this list has outperformed the S&P over the past three years except for Facebook. So while the losses in these stocks may seem unimaginable, the gains have also been unimaginable in some cases. This is typically how things work in the world of glamour stocks.
Finally, here are the factor returns for the previous three years:
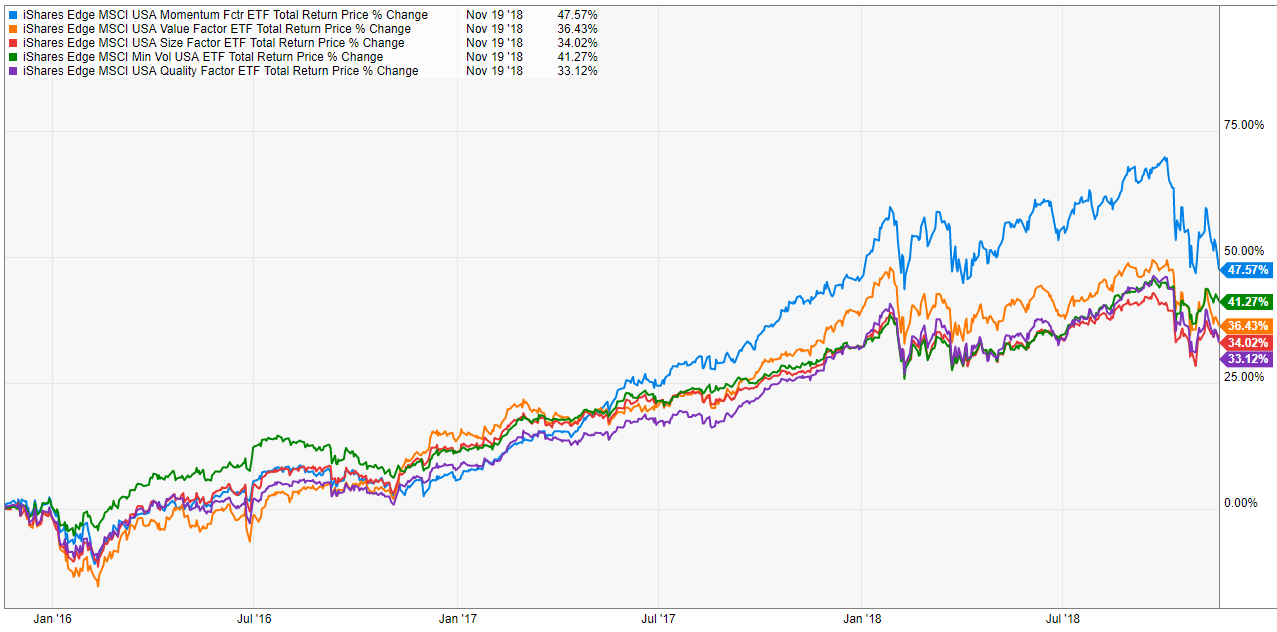
Momentum and low vol stocks are still sitting on pretty nice gains while size, value, and quality have been more or less in line with the overall market.
Do the previous gains make current losses sting any less? Probably not considering losses hurt twice as bad as gains make us feel good.
But these numbers should help put the current downtrend into perspective. Not only have stocks experienced nice gains for the past three years, but most markets, countries, sectors, and stocks are sitting on massive gains since the end of the financial crisis.
Sometimes stocks fall because of how much they’ve risen.
Based on the market open this morning it doesn’t look like things are getting better any time soon. Volatility has a nasty habit of creating more volatility.
Who knows how much further we have to fall from here but knowing where we’ve been can help put some context around the current situation.
Source:
YCharts
1All numbers are as of the close on Monday, Nov. 19 and drawdowns show peak-to-trough losses from the highs seen in 2018. If you’d like to see these graphs blown up simply right click and hit ‘Open in New Tab’ to see a larger version.
2Yes I know Facebook and Amazon technically aren’t considered tech stocks anymore but it’s impossible to properly categorize these types of stocks so I’m keeping it simple and sticking with tech for now.

