As of the market’s close yesterday the S&P 500 was down 9.4%. Not quite a 10% correction but it’s a stone’s throw away.
The question all investors would like to know is how much further this downturn has to go.
The answer is I don’t know and neither does anyone else.
But we can look back historically to see how many corrections turned into bear markets or crashes to get a better sense of the potential range of outcomes.
Going back to 1928…
When stocks fell 10%:
- 49% of the time they didn’t fall any further than 15%
- 13% of the time they didn’t fall any further than 20%
- 15% of the time they fell between 20% and 30%
- 9% of the time they fell between 30% and 40%
- 8% of the time they fell between 40% and 50%
- 6% of the time they fell more than 50%
When stocks fell 15%:
- 26% of the time they didn’t fall any further than 20%
- 30% of the time they fell between 20% and 30%
- 19% of the time they fell between 30% and 40%
- 15% of the time they fell between 40% and 50%
- 11% of the time they fell more than 50%
When stocks fell 20%:
- 40% of the time they didn’t fall any further than 30%
- 25% of the time they fell between 30% and 40%
- 20% of the time they fell between 40% and 50%
- 15% of the time they fell more than 50%
When stocks fell 30%:
- 42% of the time they didn’t fall any further than 40%
- 33% of the time they fell between 40% and 50%
- 25% of the time they fell more than 50%
When stocks fell 40%:
- 57% of the time they didn’t fall any further than 50%
- 42% of the time they fell more than 50%
When stocks fell 50%:
- 67% of the time they didn’t fall any further than 60%
- 33% of the time they fell more than 60%
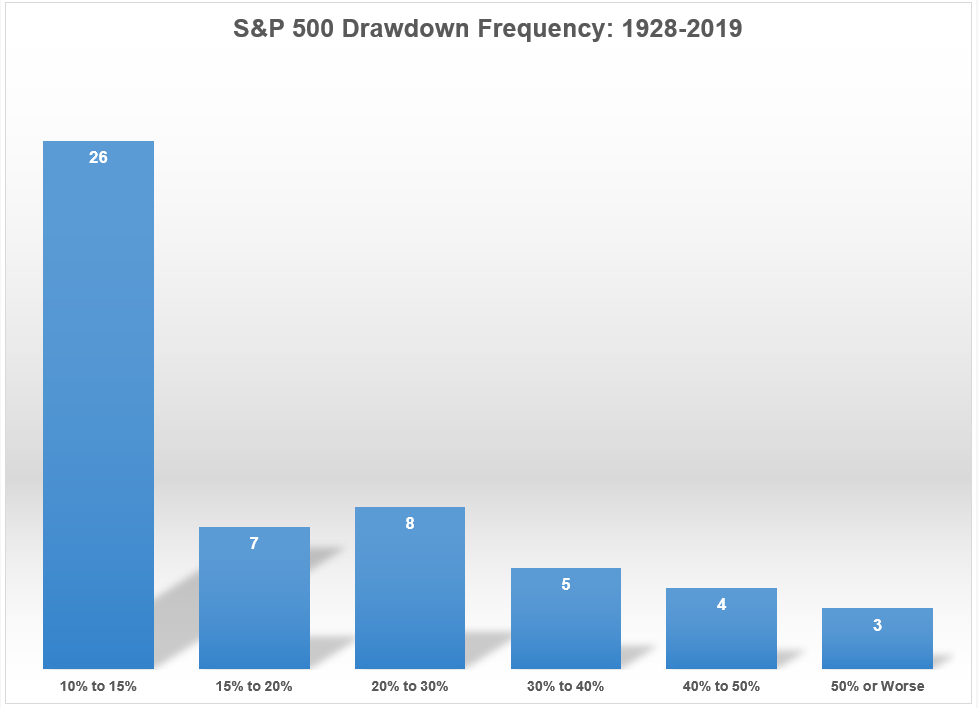
Here’s a chart showing the frequency of drawdowns by the different levels:

So roughly 60% of the time a 10% correction didn’t lead to a bear market while roughly 40% of the time it did. The further down you go on the loss spectrum the smaller the sample size but this gives you a good idea of how things have looked historically in terms of the loss profile of the stock market once they have already begun their descent.
The average correction which saw stocks drop 10% but not enter bear market territory1 was a drawdown of -14%, lasting 132 days from peak-to-trough. Bear markets in this time frame experienced a drawdown of -37% over 358 days, on average.2
Historical information like this can help put things into perspective but historical data is rarely enough to help people sleep at night or change their behavior. Market averages tell a story but no one’s experience in the markets is ever average in the moment.
The past is easy because we know what happened but the future is messy since the uncertainty of the potential outcomes cannot be reduced.
Most of the time the stock market has a run-of-the-mill correction that doesn’t turn into a bear market but a bear market is always a possibility. And every time stocks begin to fall there’s a little voice in the back of our heads that tell us, “Maybe this is the big one…”
Intelligent investors bake these scenarios into their investment plan and prepare for them in advance. No matter the path stocks take from here, if you don’t have a plan in place about how to react no matter the outcome, now would be a good time to formulate one.
Even a bad plan is better than no plan at all.
Further Reading:
To Win You Have to Be Willing to Lose
1Using 20% as our magical threshold for a bear market.
2The Great Depression skews things a little here but the numbers are what they are. Since WWII, the average bear market was a drop of 33% over 395 days, on average.
