Earlier this week, Morgan Stanley equity chief Mike Wilson told CNBC an earnings recession has arrived and the market is not ready for it:
“We are increasingly convinced that consensus earnings expectations for 2019 have further to fall and that the optimistic uptick currently baked into fourth-quarter 2019 estimates is unlikely,” Wilson wrote Monday. “A modest further decline in earnings will deliver the earnings recession we called for. Equity returns can still be positive in this environment, but they will likely be weaker than they otherwise would have been.”
It should be noted, strategists and analysts are typically overly optimistic about their earnings predictions (h/t Science of Hitting):
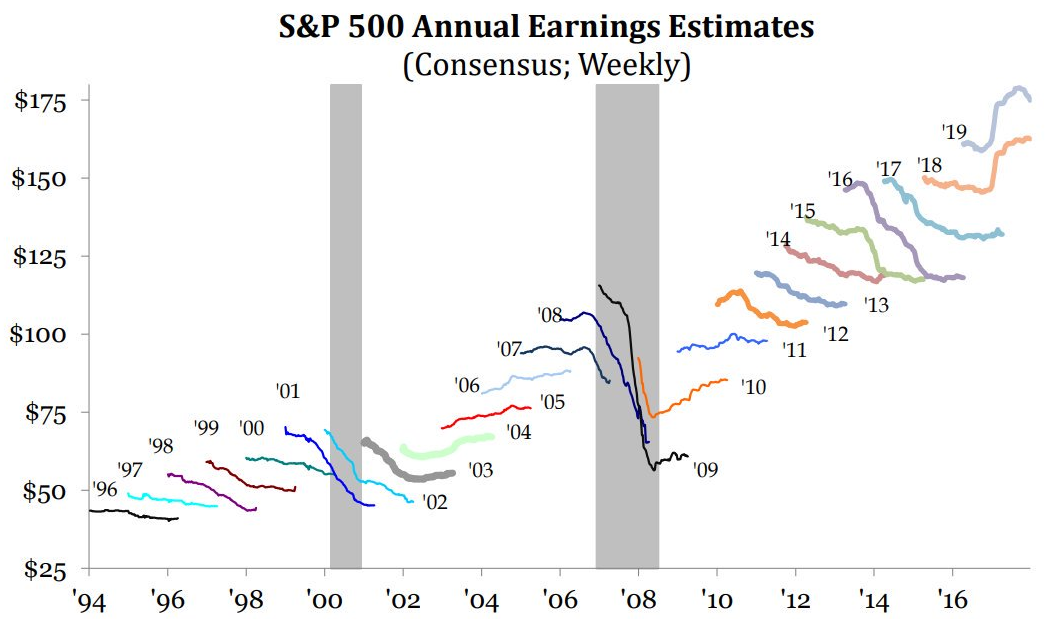
Forward earnings numbers almost always start out too high and then come back in as the year progresses. So maybe Wilson is simply getting ahead of the trend here.
Investors’ ears tend to perk up anytime the word recession gets thrown around and earnings are an important driver of long-term stock market returns as you can see from this table:
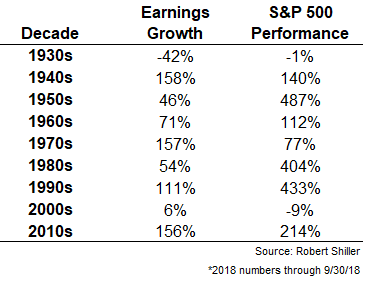
There are times when the relationship between the two variables looks strong — the 1930s, 1940s, and 2000s all tracked relatively closely.
There are also times when the two diverge from one another — stocks handily outpaced earnings growth in the 1950s, 1980s, and 1990s while earnings growth beat stocks in the 1970s.
So while earnings are important over the (very) long haul, even over decade-long periods, earnings aren’t the be-all, end-all when it comes to predicting what the markets will do.
A similar relationship exists when we look at earnings growth versus stock market performance on an annual basis:1
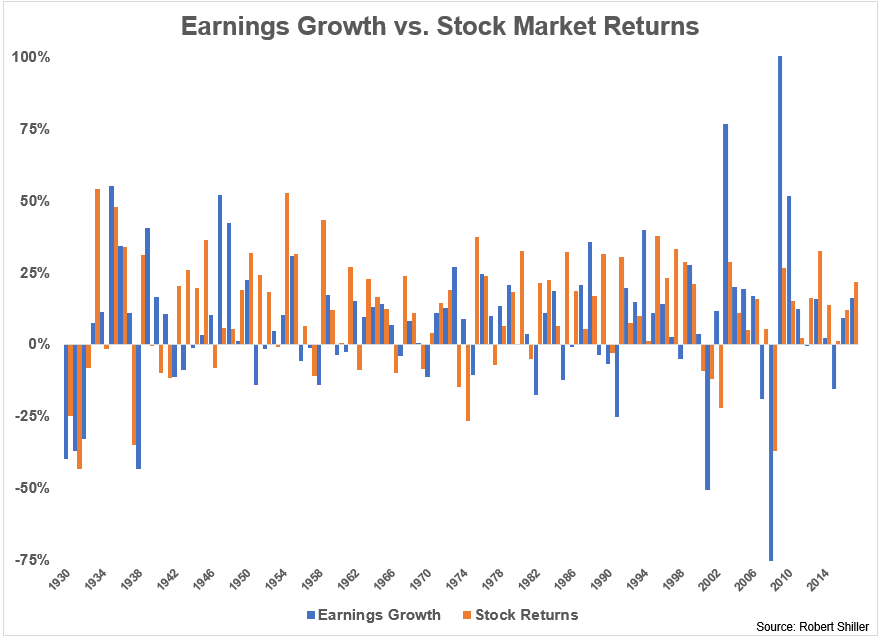
From 1930 through 20172 earnings on the S&P 500 were positive on a year-over-year basis 58 times and negative on a year-over-year basis 30 times. The majority of times when earnings were down in a given year, stocks were actually up:
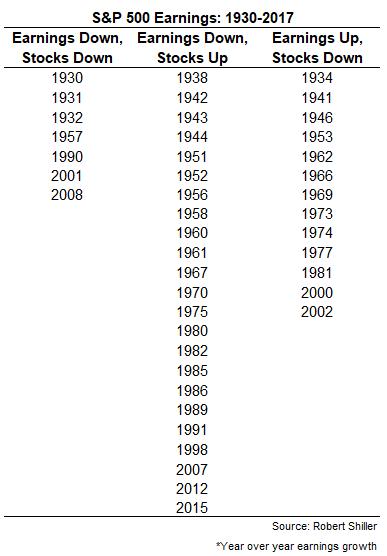
This table shows how stocks and earnings matched up in the various calendar years (obviously the ones I left off saw both stocks and earnings growth in the same year). In 23 out of the 30 down years for earnings growth, the stock market finished the year in positive territory.
In 16 of those down years, earning growth decelerated by double digits. Of those 16 years, 11 of them were up years in the stock market. And the S&P 500 rose by double digits 8 times during a year when earnings growth was down double digits.
The obvious retort to these numbers is the fact that the stock market is supposed to be forward-looking. By the time earnings numbers are released that’s already old news. It’s been priced in already.
You could make the case that the reason stocks fell in 2018 is because they were pricing in earnings weakness in 2019. So I also looked at the performance of the S&P 500 in the year prior to each down year in earnings growth to see how clairvoyant the stock market is on earnings.
Stocks were down in just 12 of the 30 years prior to an earnings decline. So roughly 40% of the time stocks may have been signaling a coming problem with earnings.
Drilling down into this data led to some interesting findings in many of the years:
- The brutal 1973-74 bear market saw stocks get chopped in half but earnings were surprisingly strong both years. Earnings grew 27% in 1973 and 9% in 1974 and that’s after growth of 11% and 13% in 1971 and 1972, respectively. Inflation was beginning to take off during these years (it was over 11% by 1974) but most investors would be surprised to find stocks down 8% over a 4 year period in which earnings grew almost 75%.
- Earnings were up 52% and 42% in back-to-back years in 1947 and 1948 but the market didn’t care, rising just 5.7% and 5.5% in those years.
- In this time frame, there were 4 periods that saw earnings decline for 3 straight years — 1930-1932, 1942-1944, 1956-1958, and 1989-1991. Stocks got shellacked in all 3 of the years from 1930-1932 but the 1940s streak saw stocks up double digits all 3 years (with stocks up 81% in total). The other 2 periods saw stocks up 2 out of 3 years, with total returns of 36% and 66%.
- On the other hand, stocks were down every year from 1939-1941, but each of those years experienced double-digit earnings growth.
For all of these numbers, you could offer reasons or caveats as to why they seem so counterintuitive when taken at face value. There’s been inflation, deflation, disinflation, high interest rates, low interest rates, expansions, recessions, and everything in-between.
But that’s the whole point here. The stock market itself is counterintuitive and any single fundamental variable won’t tell you exactly how healthy it is at any given moment. Earnings are a huge piece in the overall stock market equation, but expectations about those earnings and how investors react to them tell the bigger story.
Further Reading:
The John Bogle Expected Returns Formula
1Earnings growth in 2009 was actually 243% (mainly because it fell 78% in 2008) but I cut it off at 100% so the chart would be easier to read.
2Numbers for 2018 are only updated through September 30.

