On a recent episode of his show, Behind the Markets, WisdomTree’s Jeremy Schwartz made a comment about a stat from one of Jeremy Seigel’s books. He discussed how in real terms, bonds in the U.S. have actually experienced a much longer bear market than anything witnessed in the stock market.
This makes sense when you realize the biggest risk for stock market investors is generally a crash while the biggest risk for bond market investors is sky-high inflation.
I decided to run the numbers to put some more meat on the bones of this one to gauge the length of bear markets in both stocks and bonds on an after-inflation basis.
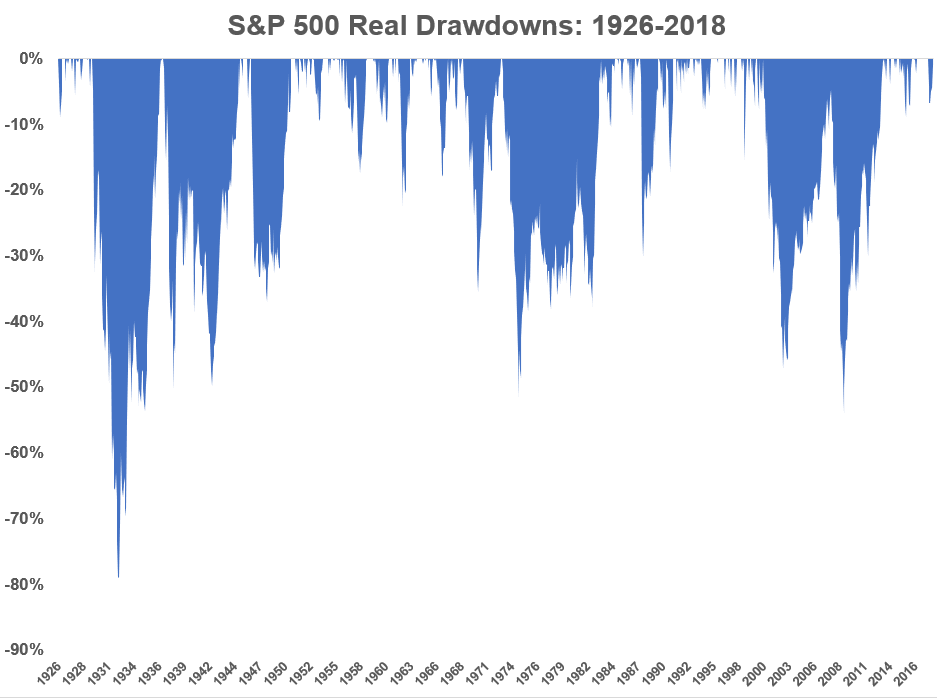
This is the historical real drawdown chart for the S&P 500:
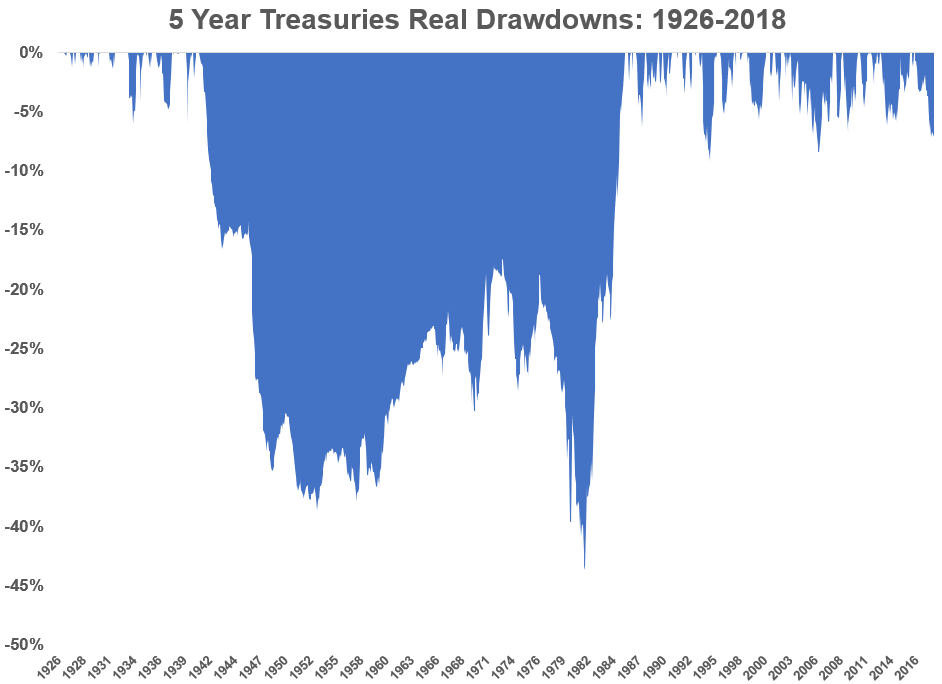
I didn’t know which route to choose for a bond proxy so I decided to look at both 5-year treasuries and long-term treasuries. Here’s the chart for the 5-year bond:
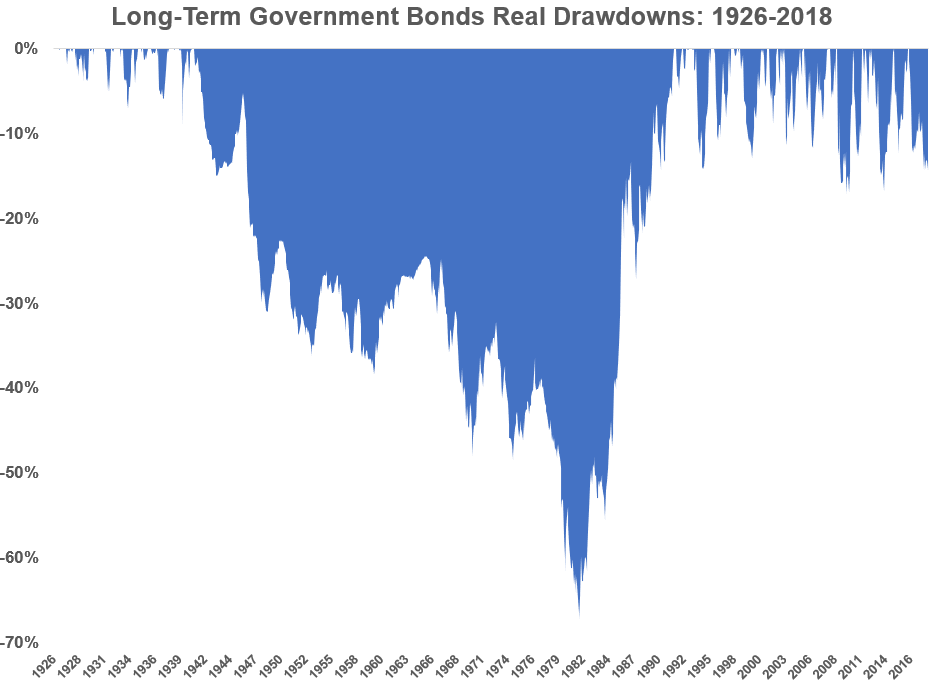
And these were the drawdowns for long-term bonds:
Here’s what the stats look like for the longest bear markets for each since 1926:1
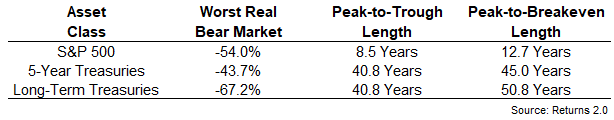
The longest drawdown for stocks in this time was from September 2000 through May 2013. Surprisingly, the massive crash during the Great Depression took just a little over 7 years to recover from on a real basis because of the deflation during that period.2
Many investors would be surprised to see the massive drawdown in bonds in the middle of each chart, both in terms of their magnitude and length. From November 1940 through September 1981, 5-year treasuries lost almost 44% of their value on a real basis while long-term treasuries lost almost 70%.
5-year bonds didn’t breakeven from those after-inflation losses until December 1985 while long-term treasuries finally broke even in September 1991. So government bonds experienced a real bear market which lasted 5 decades, almost four times as long as the worst one in the stock market.
There is room for a caveat or two on these bond numbers.
The nominal returns, before accounting for inflation, were actually pretty decent for bonds during these real bears. Over their 45 and 50-year real bear markets, 5-year treasuries and long-term bonds returned 4.6% and 4.7% respectively on an annual basis. Bond investors would kill for those types of returns at the moment if it didn’t come with that pesky inflation.
Inflation is still a relatively new phenomenon in the United States. Here’s a table that breaks it down by three distinct periods along with the overall numbers for the consumer price index:
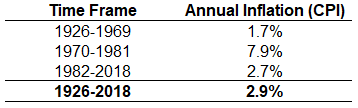
Interest rates and inflation began their upward climb from the low levels of the Great Depression in the late-1940s and 1950s but things really took off in the 1970s. That period has a lot to do with the pain bond investors experienced in that time. Inflation crushed both stock and bond investors in that decade.
This scenario could certainly play out again but interest rates and inflation in the high teens isn’t something you see on a regular basis in a mature economy.
Either way, these numbers highlight the different types of risk investors can experience. In his book Deep Risk, Bill Bernstein describes two different types of risks in the financial markets:
Risk, then, comes in two flavors: “shallow risk,” a loss of real capital that recovers relatively quickly, say within several years; and “deep risk,” a permanent loss of real capital.
Put into different words, shallow risk, if handled properly, deprives you only of sleep for a while; deep risk deprives you of sustenance.
Stock market crashes tend to fall into the shallow risk pile while the bond bear markets described here would be of the deep risk variety.
Even the most brutal of crashes in the stock market basically rip the band-aid off quickly. These periods are never easy but they don’t allow you as much time to second guess your decisions on a regular basis.
The worst kind of bear market is the one you don’t see show up on your annual statements. It’s the one that slowly drains your purchasing power over time, depleting your standard of living. With stocks that comes from selling out during the depths of a crash. With bonds it’s more of a death by a thousand cuts.
Both stocks and bonds would likely be hurt by rising inflation but stocks are the clear winner over the long haul. From 1926 through August of 2018, $1 in the S&P 500 grew to more than $573 after accounting for inflation. For 5-year and long-term treasuries, $1 grew to just $6.86 and $9.85, respectively.
Of course, the long haul is irrelevant if you can’t make it through the shallow risks, which is why Bernstein also advocates for an understanding of your cash flow needs when making allocation decisions based on your time horizon:
Capital managed for near-term liabilities should be guided by shallow risk, while capital managed for very long-term liabilities should be guided by deep risk.
The most important first step for any investor is to approach the markets with a deep understanding of your own personal time horizon and risk profile.
Further Reading:
What is a Bond Bear Market Anyways?
1I used monthly returns, not daily, for this data because that’s the only way to perform this analysis on a real basis.
2Although it should be noted the reprieve from the 1929-1932 crash was short-lived as a few months after the breakeven there came the crash of 1937 which didn’t see stocks regain their real peak until 1945.
