While the markets have been rocking across the globe in 2017 without a hint of volatility, the current bull market hasn’t always been easy. The S&P 500 hasn’t hit the standard definition of a bear market (a drawdown of 20% or more) in many years but a number of other markets did in late-2015/early-2016. Small cap stocks in the U.S. were down almost 30% in that time. This is nothing new as small cap stocks tend to perform differently than their large cap brethren. As investors look to diversify beyond the S&P 500, it makes sense to understand how other markets generally behave. The following piece I wrote for Bloomberg gives a historical look at small caps and their cyclical nature.
*******
In the month after the U.S. presidential election, small-cap stocks rallied hard, gaining more than 16 percent from early November to early December. Then they went nowhere for the next nine months as the Russell 2000 Index was actually lower by the end of August than it was on Dec. 9, 2016.
After this period of consolidation, when almost every other equity market on the globe showed large gains, small-cap stocks have finally decided to join the party. They have broken out with a number of all-time highs in recent weeks. After a slow start to the year, the Russell 2000 is up more than 10 percent compared with a gain of almost 14 percent gain for the S&P 500.
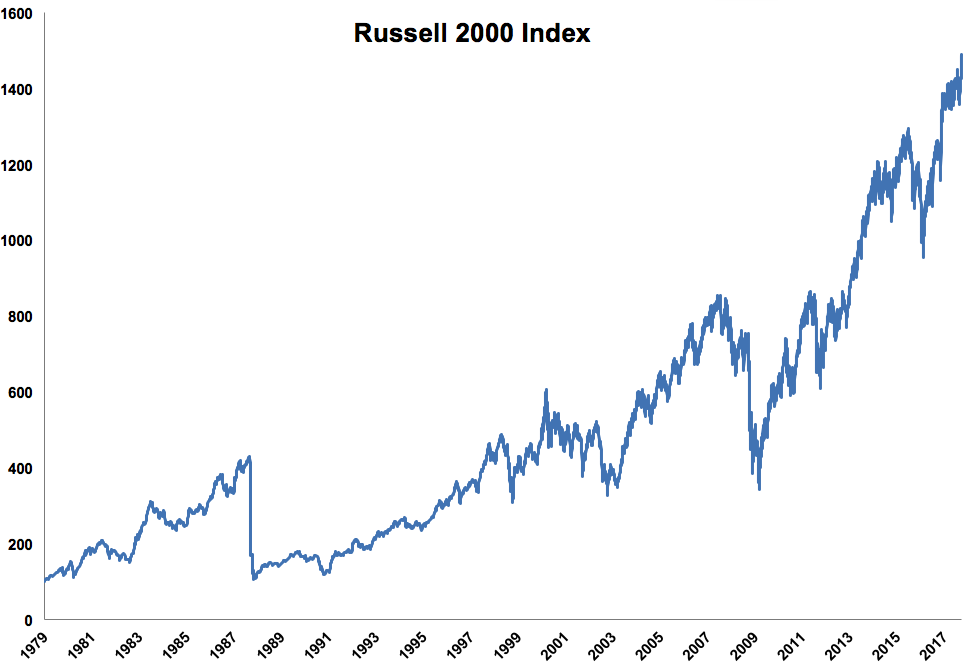
Since the inception of the Russell 2000 in 1979, there have been over 800 all-time highs in the index. The S&P 500 has had close to 740 highs in that time frame. The following chart breaks out the Russell 2000 highs by year:

As you can tell from the chart, highs tend to cluster. Although 2013 was a breakout year for small-cap stocks there have been a steady number of all-time highs in the ensuing years. All-time highs can’t continue uninterrupted forever, but the fact that small caps are breaking out could give an indication that investors are rotating into riskier segments of the market.
Although small caps have had a good burst in performance it’s worth remembering how volatile they can be. Most investors may not realize it, but small caps experienced a bear market beginning at the tail end of 2015 through the early months of 2016. The Russell 2000 fell almost 27 percent from peak to trough. Small-cap stocks have a history of more and larger drawdowns than their large-cap counterparts. The following table shows every Russell 2000 double-digit decline since inception along with the corresponding S&P 500 drawdowns:
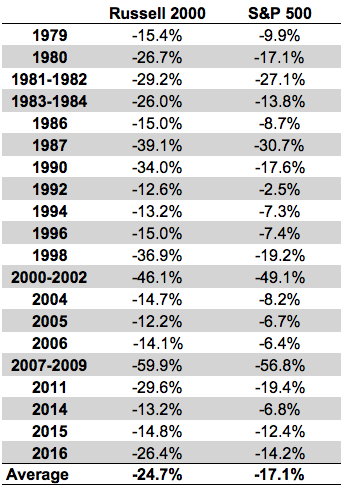
Investors often look to see if small-cap losses will portend bad things for large caps. Most of the time these are false signals as the S&P 500 saw single-digit losses during about half of all double-digit drawdowns by small caps. And since 1979, small caps have had 11 down calendar years to just six for the S&P 500. Historically, volatility in small caps is about 20 percent higher than volatility in large caps.
This works both ways. The Russell 2000 ETF is up almost 8 percent over the last month alone, accounting for the majority of the gains in small caps this year. While the returns on the two indexes have been similar over the past 38-plus years, the path to get there has not always seen small caps and large caps in sync with one another.
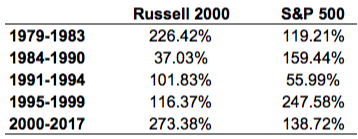
As my Bloomberg Gadfly colleague Nir Kaissar pointed out in a recent piece, small-cap stocks have outperformed large-cap stocks if we take our analysis all the way back to the 1920s using Fama-French data. Many investors have begun to question in recent years whether this can keep up with the proliferation of smart beta funds and easier access to small-cap companies through ETFs and mutual funds. Even if small caps don’t outperform going forward they can still provide investors with valuable diversification benefits. You can see the cyclical nature of their return streams when broken out by different time frames:
One of the biggest problems with smaller companies is that they tend to go out of business or become distressed much more frequently than larger companies. Research from AQR Capital Management shows that, historically, the results for small-cap stocks can be improved if you control for quality, or remove “junk” from the equation.
AQR defines quality in terms of profitability, the growth and volatility in profits, the amount of leverage employed, stock volatility, and how much profit is returned to shareholders. Ranking companies based on these factors improved the results over the simple small-cap premium and also led to better performance when small caps were out of favor. The idea is to avoid owning “junk” stocks that are illiquid, have low average returns, are too small to trade and show up in the distressed category.
As small caps break out to new all-time highs it makes sense for those who do own smaller companies to remember how this group typically operates. Small-cap stocks exhibit higher volatility than large caps because they are riskier businesses. As long as you understand their volatile nature and control for quality, small caps can make for a valuable portfolio diversifier for those investors who can stomach the ups and downs.
Originally published on Bloomberg View in 2017. Reprinted with permission. The opinions expressed are those of the author.
