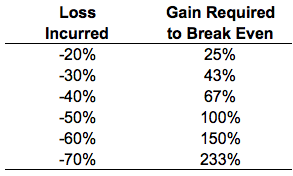
Traders and investors alike often invoke the following chart to remind themselves that losses can be painful because of the fact that they require much larger percentage gains to make them back:

I get why people pay attention to these kinds of charts. Risk management is important for a number of reasons, such as the management of drawdowns and volatility in your portfolio along with the management of your behavior.
But managing risk exclusively to the downside can mean you miss out on much of the upside, as well. And volatility to the upside is often much more muted than it is to the downside for the simple fact that people tend to panic when things are going wrong and they’re losing money.
If you focus exclusively on preserving capital and always position yourself for the next huge market crash, you’re likely to miss out on substantial market gains. And missing out on large gains can be just as detrimental to your investment performance as taking part in large losses.
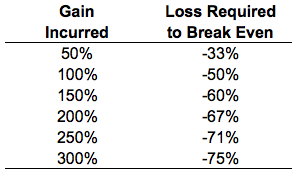
Here’s the flipside of the table from above:

Whereas the first table showed the gains required to breakeven from a large loss, this one shows the loss required to breakeven after missing out on a large gain.
The current recovery from the 2007-2009 market crash provides a perfect example of this. Let’s say you decided to sell out of U.S. stocks after experiencing losses of close to 40% in 2008 and you’ve been in cash ever since (this scenario is not as improbable as you would think based on the emails I receive from readers).
From the start of 2009 through the end of 2017 the S&P 500 is up around 255% in total. If you’ve been out of the market for this entire run for whatever reason, you would need to see stocks fall more than 70% just to get back to the levels where you initially sold.
Nothing is ever out of the question when it comes to the stock market but those kinds of losses are rare, to say the least, considering U.S. stocks have only ever fallen by that much during the Great Depression.
Or let’s say your favorite market guru called for a huge crash after stocks rose more than 30% in 2013 and scared you out of your stock holdings. Well since the end of 2013, the S&P 500 is up almost 60%. So just to get back to the level where that crash-caller got you out of stocks they would have to fall almost 40% (and then crash even further from there to allow your pundit to be “right”).
Of course, this doesn’t mean that stocks can’t or won’t fall from current levels. They certainly could. Or they could continue to trudge higher in the face of all the bubble calls we’ve been hearing for 4-5 years.
I’m not trying to tell you to ignore risks in the stock market because that would be irresponsible. My point here is that the opportunity cost of missing out on huge gains in the markets can be just as important or even more important than taking part in huge losses.
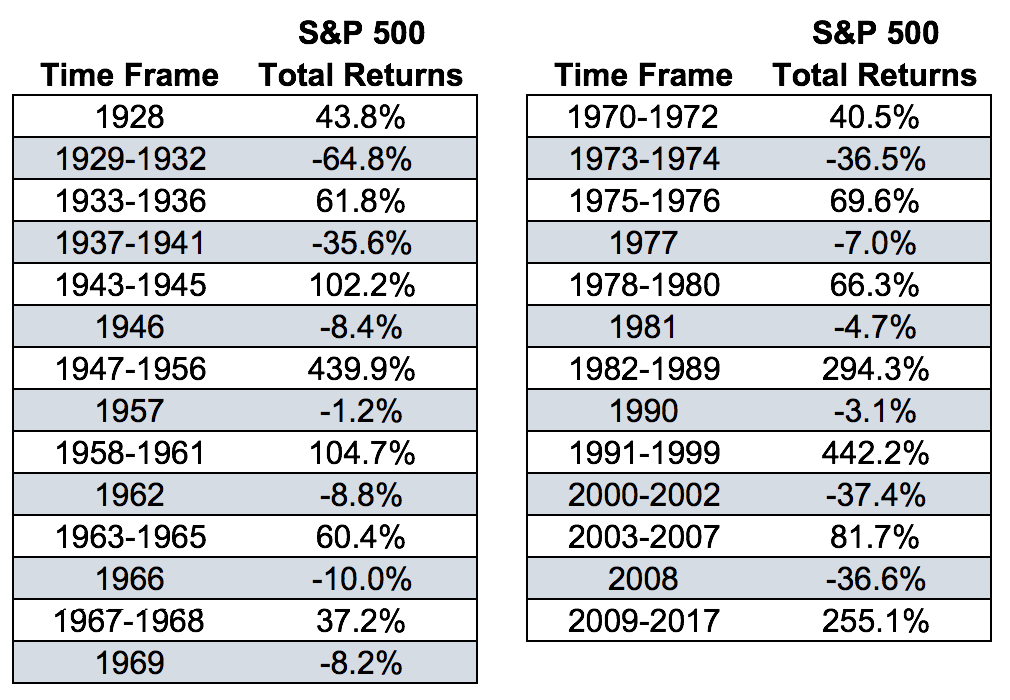
And the fact of the matter is that the gains typically last much longer than the losses if we use history as our guide. Take a look at the various streaks in the S&P 500 going back to the late-1920s to see how this plays out using calendar year returns:

Granted, there were much larger losses (and gains) in-between these calendar year-end numbers. But what I’m trying to show here is that, over the long-term, while there are losses in stocks, the large gains significantly outweigh the large losses in terms of both magnitude and duration.
I’m certainly not advocating for investors to abandon downside risk management and ignore the impact losses can have on both your bottom line and your psyche as an investor. Even though the losses may pale in comparison to the gains over the very long haul, those losses sting twice as bad as the gains feel good because of our inherent loss aversion.
But investors who focus exclusively on downside protection without a plan for how to handle the upside will be sorry. No one really views upside in the markets as a risk but it certainly can be a risk if you miss out on large gains or have no plan of attack for how to handle them.
Further Reading:
How to Survive a Melt-Up
