Investors are inundated with rules of thumb, anecdotal evidence, and soundbites that are put out there as 100% fact yet nothing to back them up. Markets don’t have hard and fast rules that you can follow where the future will always look like the past. But there are many myths purported to be true that I’ve seen over and over again the past few years that have been harmful to investors who haven’t looked into them completely. This piece I wrote from Bloomberg looks at some of the more egregious ones I’ve seen lately.
*******
There are a number of rules of thumb and aphorisms that investors accept without investigating their merits based on the historical evidence. For example, many assume that buying individual bonds is safer than owning a bond mutual fund or ETF because it will shield them from interest-rate risk. The idea is that bond funds can fall in value but individual bonds will mature at par, so you don’t have to worry about losses when you hold them directly.
This misses the point that bond funds are simply the sum of the individual bonds they hold. Investors who hold individual bonds to maturity will still see losses in the meantime as their bonds are marked to market if interest rates rise substantially. By holding bonds to maturity, investors will get all of their money back, but if interest rates have risen, inflation has likely risen as well, meaning their dollar now has less buying power. Risk never completely goes away in the markets, so this strategy is really just trading one risk for another.
Here are a few more market-related arguments that don’t add up:
Low volume rallies spell trouble for stocks. People have been warning about low-volume rallies since the market bottomed in 2009. The idea here is that if trading volume is lower than normal, then institutional investors must not be participating in the rally. This makes no sense. Trading volume in the 1950s was about 3 million shares a day on the New York Stock Exchange. Over the past three months, the SPY ETF alone has traded an average of about 62 million shares a day. More investors turning over shares doesn’t have anything to do with the direction of the markets. In fact, investors tend to trade more when stocks are falling, because that’s when people panic.
There is tons of cash on the sidelines. On the flipside of the low volume rally is the idea that there is a magical stockpile of cash “on the sidelines,” just waiting to be invested. This argument runs into trouble when you realize that there is a seller for every buyer and a buyer for every seller. Markets are not a one-way street. Every trade is an exchange between two parties. Allocations can change over time, but there’s never going to be a flood of cash entering the markets because all that would mean is a flood of cash going right back out to those who sold.
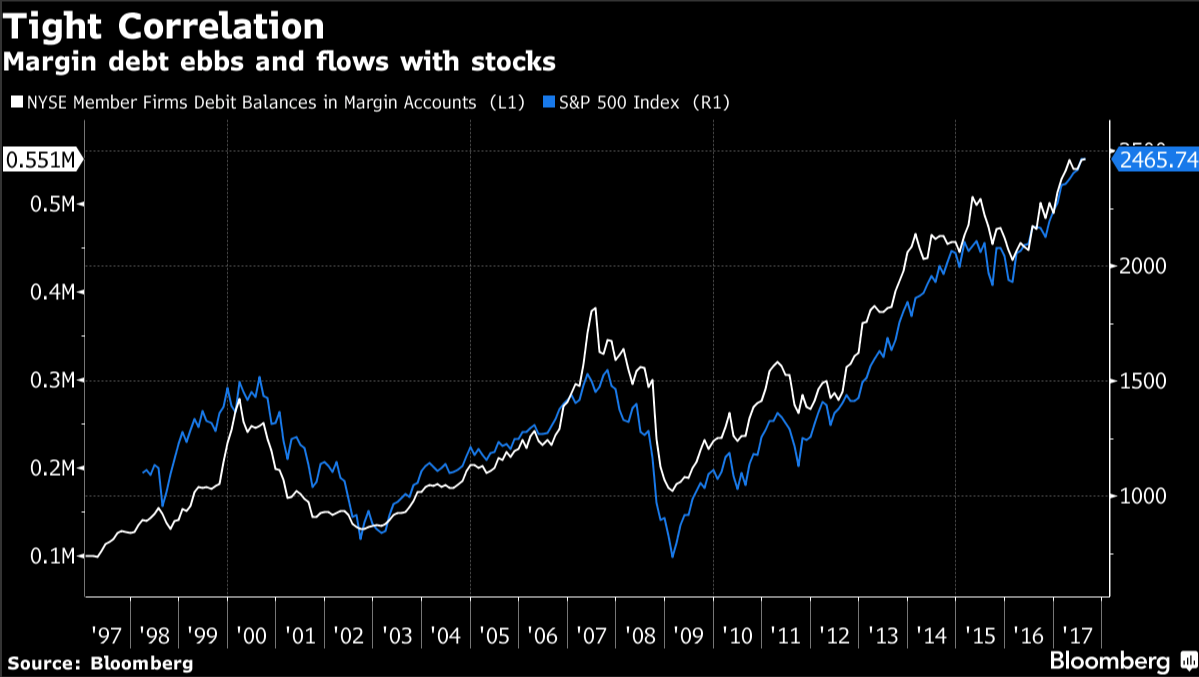
Margin debt at all-time highs means euphoria in the markets. Margin debt reflects the amount of borrowed money used to purchase securities in the markets. It sounds scary when people point to margin debt at an all-time high because that means investors are borrowing more money than ever to buy stocks. The following shows how margin debt has peaked when the market has peaked in the past:

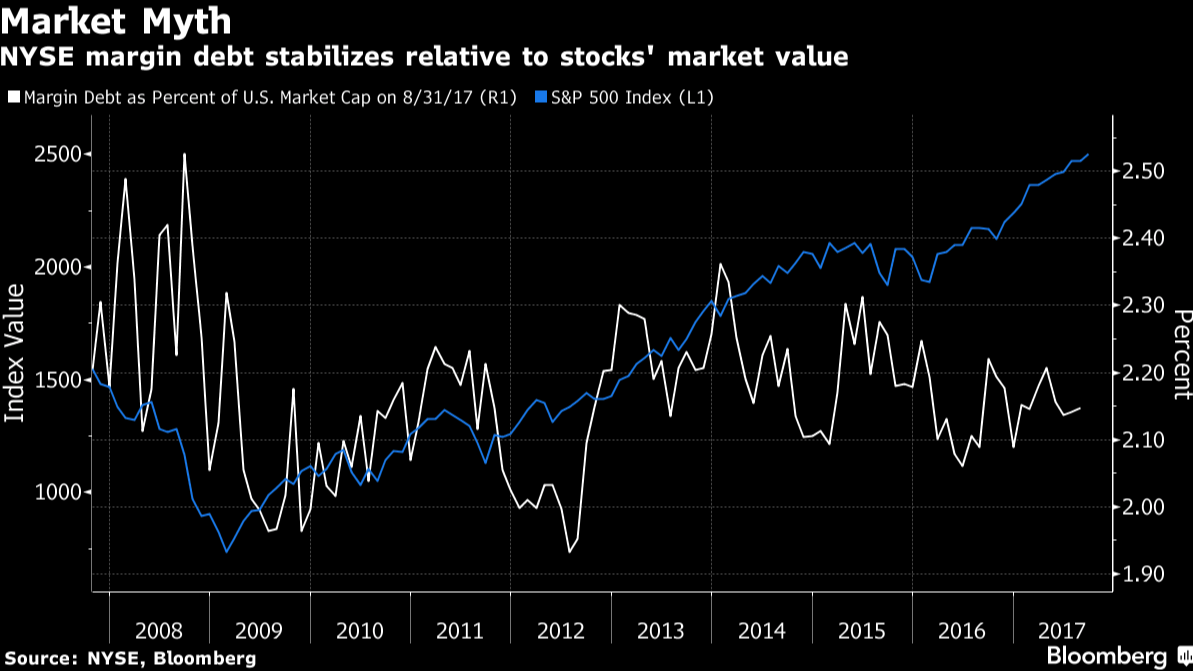
But this indicator doesn’t really tell us anything. As markets rise, margin debt will rise. As markets fall, margin debt will fall. All historical margin debt peaks tell you is that margin debt fell when stocks fell. The following chart is more useful, as it shows margin debt as a percentage of the overall market cap of the stock market:

Margin debt is a backward-looking indicator that tells you nothing else beyond how the stock market has performed in the past.
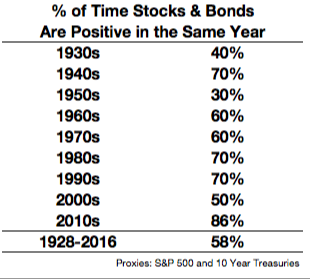
Something’s gotta give between stocks and bonds. Investors often assume stocks or bonds are telling them something. So when both rise at the same time, the assumption is that either the equity or fixed-income market must be wrong. The problem with this line of thinking is that stocks and bonds both go up over time, and most of the time they go up at the same time. The following table shows how often stocks and bonds both shown gains in the same calendar year by decade going back to the late 1920s:

Most of the time, stock and bond markets are rising and doing so in concert.
Bonds always lose money when interest rates rise. Bond prices and interest rates are inversely related. When one rises, the other falls, and vice versa. But this relationship ignores the income portion of the total return an investor earns in bonds. For example, looking at five-year Treasury notes going back to 1954 shows that on a monthly basis, when the yield rose, 54 percent of the time there was a negative return. That means 46 percent of all monthly returns were positive when rates were rising.
Originally published on Bloomberg View in 2017. Reprinted with permission. The opinions expressed are those of the author.
