The price of oil seems to be at the forefront of every market and economic conversation these days. That tends to happen when one of the most important commodities on the planet falls 80% in a short period of time. Is it too much supply? Not enough demand? The pricing in of future technological advancements? Speculators? No one really knows, but it’s likely not one factor that’s caused this massive repricing.
Regardless of the reasons, market participants are paying attention. Per the Wall Street Journal yesterday, the correlation between stock prices and oil prices have reached a new all-time high this month:
The correlation between daily moves in the price of Brent and the S&P 500 stock index is at levels not seen in the past 26 years. January isn’t over yet, but over the past 20 trading days—an average month—the correlation is 0.97, higher than any calendar month since 1990, according to data from both benchmarks examined by The Wall Street Journal. A correlation of 1 would mean oil and stock prices move by the same proportion in the same direction, while a correlation of minus 1 would mean they move proportionally in opposite directions.
This seems like a pretty scary statistic, but when you look at the daily returns of the S&P 500 and oil prices it’s much harder to find as close of a relationship as they a laying out:
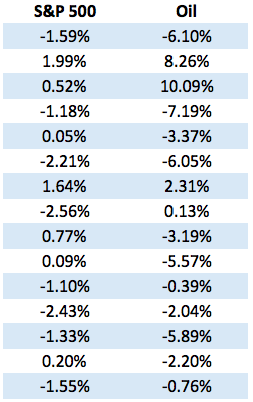
While there have been days when both have risen and fallen at the same time it’s hard to claim that the magnitude of the moves in stock prices has been anywhere near the moves in oil. If you were to look at the standard deviation in returns, oil has had roughly four times the volatility as stock prices.
The problem here is that correlation can be a crude statistic (sorry, I couldn’t help myself). Correlation provides a statistical relationship of price movements but it’s not perfect. Even if correlations between assets are trending higher that doesn’t mean that the outcomes have to be even remotely similar. While stocks are down around 8% this year, oil has fallen nearly 20%.
You also have to put into perspective the fact that we’re dealing with two highly volatile assets here that have a highly volatile historical relationship. See the rolling 90 day correlation between stocks and oil going back to the early 1980s:
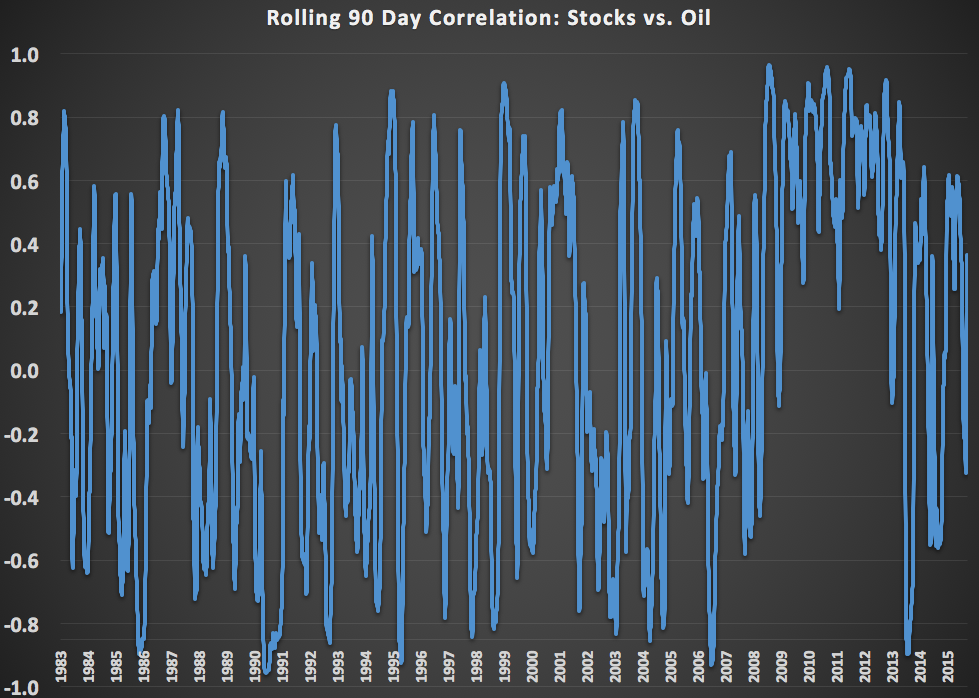
The correlation swings wildly from positive to negative to no correlation whatsoever.
It’s hard to believe, but this drawdown in oil is not as unheard of as it may seem. Every single decade going back to the 1980s has experienced a bone-crushing crash in the price of oil. Here are the largest drawdowns by decade:
- 1980s: -67%
- 1990s: -72%
- 2000s: -76%
- 2010s: -80%
There are many conclusions being drawn at the moment about the price of oil and its impact on the financial markets. My take is that it’s nearly impossible to have any hard and fast rules with this type of thing when there are so many moving parts to consider. There have been obvious psychological issues on market sentiment and there will surely be economic consequences when all is said and done.
But when you’re dealing with extreme volatility it’s difficult to determine the difference between the price and the narrative.
Source:
Oil, Stocks at Highest Correlation in 26 Years (WSJ)
Further Reading:
A Lesson in Portfolio Correlations


Finally sanity. Fisher investments has an article with the same sentiment.
Hear hear