After the Dow Jones Industrial Average reached the meaningless psychologically significant 1,000 point level in 1966, the market began to falter. During this correction Warren Buffett began to hear from a handful of the investors in his partnership who warned him that the market could decline even further. Buffett said that these predictions brought up two interesting questions:
- If they knew in February that the Dow was going to 865 in May, why didn’t they let me in on it then; and
- If they didn’t know what was going to happen during the ensuing three months back in February, how do they know in May?
Following the market crash and the Great Recession it seems that everyone in the market has decided it’s now quite easy to call the next correction or market peak. Just ask them. The hindsight bias has everyone thinking it was a lay-up to see what was coming and if they can only do it again their portfolio will be safe from harm. Unfortunately, calling a top is not as easy as it looks in the rearview mirror.
Take a look at some of the prior peaks over the past five plus decades along with some relevant market indicators (click to enlarge):
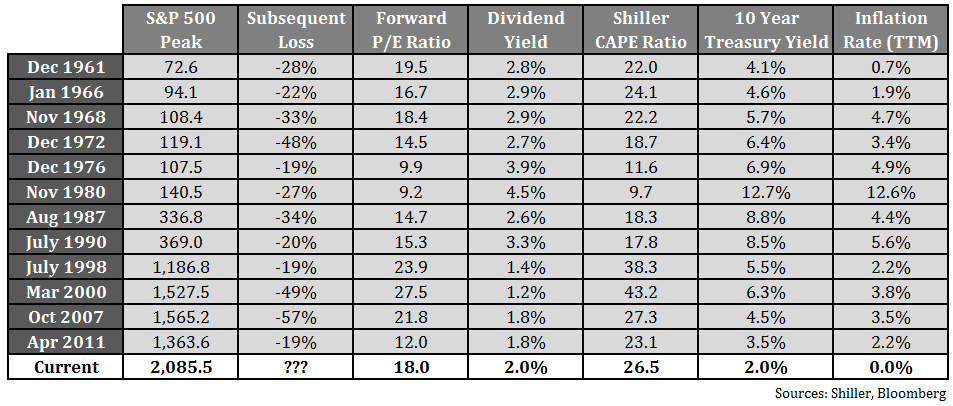
Good luck finding a discernible pattern among these prior market peaks. In November of 1980, stocks traded for less than 10 times earnings, a screaming deal, yet they still fell almost 30%. Stocks can and will fall for any number of reasons, but as the old saying goes, no one rings a bell at the top. One of the hardest things about the markets for investors to understand is how long trends and momentum can take to play out.
When I think about drivers of market returns, there are three main components investors should consider — fundamentals, sentiment and trends. I think investors have a reasonable understanding of valuations (although many place too much emphasis on them) and people are starting to come around to the importance of behavioral finance. It’s the power and magnitude of market trends that remains under-appreciated.
In early 2013, it became fashionable to say that U.S. stocks were reaching extreme levels of overvaluation. Since the start of that year stocks are up 55%. If you missed out on that rally because you got scared out of stocks, that’s about five years’ worth of average historical market gains that were missed (obviously this works the opposite way when stocks fall).
It would be a tough sell for anyone to say that stocks are cheap at the moment. They’re not. But they shouldn’t be cheap after one of the strongest bull markets in history. Investors need to reset their expectations if they think the types of gains we’ve seen since 2009 are sustainable. Maybe we’re approaching a market top and a bear market is on the horizon. But it’s also possible that stocks continue to rise. That’s not the analysis investors would like to hear, but trying to gauge investor sentiment over the short-term is a crap-shoot.
Investors have become infatuated with calling the next correction, crash or market top because so many lost money during the last crisis. The next time the market tops out it will seem so easy to have predicted it after the fact. Getting there ahead of time is the tricky part that no one has quite figured out yet with any precision.
Source:
Buffett: The Making of an American Capitalist
Further Reading:
Defining This Time is Different
Risk Management Always Matters
Here’s what I’ve been reading lately:
- This video on how your brain plays tricks on you is crazy (Investor’s Field Guide)
- How to invest for your kid’s college education (Clear Eyes Investing)
- The uncertain future of robo-advice (EconomPic)
- The reason charlatans exist is because people crave certainty (Reformed Broker)
- The worst investment strategy ever (Irrelevant Investor)
- Margin debt hits an all-time high…so what? (Big Picture)
- “There is nothing like success to blind one to the possibility of failure.” (Farnam Street)
- Winning the advisor’s game: An interview with Charley Ellis (Vanguard)
- There are many ways to be an investor (Monevator)
- Reminiscences of Marty Zweig (Charles Schwab)


This is the “fuzzy” logic behind fundamental valuation metrics. They can serve as a guide towards over/under valuation in hindsight, yet are ambiguous in providing a set logic in making tactical asset allocation decisions. Once past this initial hurdle, a quantitative tactical modeler needs to develop and implement “rigid” variables in the formation of the model’s decision logic. If the model’s long term alpha and signal history is robust enough, the manager can then have the confidence to see beyond the notions of “missing the top / bottom” and not fall into cognitive traps when the market continues higher when the model is in defense or when the market is going lower and model is allocated towards equities. The presentation below shows this confidence and long term alpha portrayed graphically over 9 decades: https://docs.google.com/presentation/d/10n7vUDLdvrcPncEVXWa0aMFTdtWkkRavSLczS34RsCk/edit?usp=sharing
Yes, valuations can be a guide to set expectations but should still always plan on a range of outcomes. See here:
https://awealthofcommonsense.com/cape-ratio-range-historical-outcomes/
Fantastic article as always Ben, always impressed.
Thank you.
Great post. Not sure if this was intended, but the headline has me singing this to myself https://www.youtube.com/watch?v=InGtiEXQyF0
Nice. That may have been subliminally in the back of my mind. One of my high school jams.
[…] https://awealthofcommonsense.com/so-you-want-to-be-a-top-caller/ (@awealthofcs) […]
Good article, which illustrates the tension between investment management as a science or an art. As professionals, we like to portray ourselves as logical, rational, fact-based practitioners, but the ugly truth is that the best “science” will not always produce the best outcomes. Sometimes, its just better to be lucky than skillful. In response to changing circumstances, the best solution may be to do nothing (or very little) and continue to focus on long term outcomes that will outweigh short-term volatility. However, clients tend to want to see their managers doing something for their fees, even when what they want can’t be achieved (the “crystal ball” theory of asset management) or makes no sense (“go to cash!”).
Yes, well said. It’s difficult for people to understand the difference between risk management and making precise predictions. The best you can do is plan for a wide range of outcomes. And sometimes making good decisions can lead to poor short-term outcomes. Never easy…
[…] • Back to Basics: Why G.E. Ditched Finance (New Yorker) • So You Want to be a Top Caller? (A Wealth of Common Sense) • Andreessen Horowitz, Dealmaker to the Stars of Silicon Valley (The Upshot) • Want a Steady […]
[…] try to call the top. Take a look at the table from Ben Carlson and see if you can find a […]
[…] try to call the top. Take a look at the table from Ben Carlson and see if you can find a […]
[…] try to call the top. Take a look at the table from Ben Carlson and see if you can find a […]
Somebody tell Bill Gross! https://www.janus.com/bill-gross-investment-outlook
Yes, it was also hard when it was called in 2010, 2011, 2012…
The one thing you left out of the chart, and it is the most important in my opinion, is the amount and number of Fed Fund increases.
Yup companion piece to that is here:
https://awealthofcommonsense.com/happens-stocks-bonds-fed-raises-rates/
[…] Reading: So You Want to be a Top Caller? The Psychology of Sitting in […]
[…] Further Reading: What Constitutes Long-Term in the Stock Market? So You Want to be a Top Caller? […]